
Pre-Requisites
- Kubernetes Cluster
- Application Deployed into the Cluster (See Part 2)
Introduction
The first time we deploy workloads to a Kubernetes cluster, we can't be certain about the resources required and how the requirements may change depending on user traffic, external dependencies, etc.
Horizontal Pod Autoscaling (HPA) helps to ensure that workloads function consistently in different situations. It's also a way to manage costs and ensure that resources aren't wasted during low traffic.
The HPA automatically scales pods up and down based on some of the metrics mentioned below:
- Actual Resource Usage: When a Pod's CPU and/or memory usage exceeds a specified boundary, it can be expressed in raw value or percentage.
- Custom Metrics: It can also scale based on metrics reported by a Kubernetes Object in the cluster, like request rate and disk I/O writes/s. (Helpful if the app is vulnerable to network/disk bottlenecks)
- External Metrics: Based on the metrics from an app or service external to the cluster.
How Does It Work?
A Horizontal Pod Autoscaler checks a given pod's CPU/MEMORY usage from time to time and compares it against the target threshold. If the values are found to have crossed the threshold, then the replicas are increased or decreased accordingly.
It accomplishes this using data from the metrics server. It's a monitoring service provided by the maintainers of Kubernetes. The metrics server keeps track of the resource usage of each pod in the cluster, stores the data in etcd, and provides data to the HPA when requested via the metrics server API.
Installing Metrics Server
The metrics server can be installed using the YAML(s) provided below. You can save and deploy them using the following command:
kubectl apply -f <File-Name>.yaml
The ServiceAccount will be required for all operations to be performed in the cluster.
---
apiVersion: v1
kind: ServiceAccount
metadata:
  labels:
    k8s-app: metrics-server
  name: metrics-server
namespace: kube-systemThe ClusterRole will provide the necessary permissions.
---
apiVersion: rbac.authorization.k8s.io/v1
kind: ClusterRole
metadata:
  labels:
    k8s-app: metrics-server
    rbac.authorization.k8s.io/aggregate-to-admin: "true"
    rbac.authorization.k8s.io/aggregate-to-edit: "true"
    rbac.authorization.k8s.io/aggregate-to-view: "true"
  name: system:aggregated-metrics-reader
rules:
- apiGroups:
  - metrics.k8s.io
  resources:
  - pods
  - nodes
  verbs:
  - get
  - list
  - watch
---
apiVersion: rbac.authorization.k8s.io/v1
kind: ClusterRole
metadata:
  labels:
    k8s-app: metrics-server
  name: system:metrics-server
rules:
- apiGroups:
  - ""
  resources:
  - nodes/metrics
  verbs:
  - get
- apiGroups:
  - ""
  resources:
  - pods
  - nodes
  verbs:
  - get
  - list
- watchThe Role Binding attaches the Service Account with the ClusterRole we created.
---
apiVersion: rbac.authorization.k8s.io/v1
kind: RoleBinding
metadata:
  labels:
    k8s-app: metrics-server
  name: metrics-server-auth-reader
  namespace: kube-system
roleRef:
  apiGroup: rbac.authorization.k8s.io
  kind: Role
  name: extension-apiserver-authentication-reader
subjects:
- kind: ServiceAccount
  name: metrics-server
namespace: kube-systemClusterRoleBinding is also the same as Role Binding, but the main difference is that it is Cluster wide rather than namespace bound, which is the case for RoleBinding.
---
apiVersion: rbac.authorization.k8s.io/v1
kind: ClusterRoleBinding
metadata:
  labels:
    k8s-app: metrics-server
  name: metrics-server:system:auth-delegator
roleRef:
  apiGroup: rbac.authorization.k8s.io
  kind: ClusterRole
  name: system:auth-delegator
subjects:
- kind: ServiceAccount
  name: metrics-server
  namespace: kube-system
---
apiVersion: rbac.authorization.k8s.io/v1
kind: ClusterRoleBinding
metadata:
  labels:
    k8s-app: metrics-server
  name: system:metrics-server
roleRef:
  apiGroup: rbac.authorization.k8s.io
  kind: ClusterRole
  name: system:metrics-server
subjects:
- kind: ServiceAccount
  name: metrics-server
  namespace: kube-system
The following contains YAML Manifest for the Metrics Server Deployment.
---
apiVersion: v1
kind: Service
metadata:
  labels:
    k8s-app: metrics-server
  name: metrics-server
  namespace: kube-system
spec:
  ports:
  - name: https
    port: 443
    protocol: TCP
    targetPort: https
  selector:
    k8s-app: metrics-server
---
apiVersion: apps/v1
kind: Deployment
metadata:
  labels:
    k8s-app: metrics-server
  name: metrics-server
  namespace: kube-system
spec:
  selector:
    matchLabels:
      k8s-app: metrics-server
  strategy:
    rollingUpdate:
      maxUnavailable: 0
  template:
    metadata:
      labels:
        k8s-app: metrics-server
    spec:
      containers:
      - args:
        - --cert-dir=/tmp
        - --secure-port=4443
        - --kubelet-preferred-address-types=InternalIP,ExternalIP,Hostname
        - --kubelet-use-node-status-port
        - --metric-resolution=15s
        image: k8s.gcr.io/metrics-server/metrics-server:v0.6.1
        imagePullPolicy: IfNotPresent
        livenessProbe:
          failureThreshold: 3
          httpGet:
            path: /livez
            port: https
            scheme: HTTPS
          periodSeconds: 10
        name: metrics-server
        ports:
        - containerPort: 4443
          name: https
          protocol: TCP
        readinessProbe:
          failureThreshold: 3
          httpGet:
            path: /readyz
            port: https
            scheme: HTTPS
          initialDelaySeconds: 20
          periodSeconds: 10
        resources:
          requests:
            cpu: 100m
            memory: 200Mi
        securityContext:
          allowPrivilegeEscalation: false
          readOnlyRootFilesystem: true
          runAsNonRoot: true
          runAsUser: 1000
        volumeMounts:
        - mountPath: /tmp
          name: tmp-dir
      nodeSelector:
        kubernetes.io/os: linux
      priorityClassName: system-cluster-critical
      serviceAccountName: metrics-server
      volumes:
      - emptyDir: {}
name: tmp-dirAPIService extends the Kubernetes API for compatibility with Metrics Server. This is the main point of communication for metrics-related requests like HPA, VPA, Viewing Metrics, etc.
---
apiVersion: apiregistration.k8s.io/v1
kind: APIService
metadata:
  labels:
    k8s-app: metrics-server
  name: v1beta1.metrics.k8s.io
spec:
  group: metrics.k8s.io
  groupPriorityMinimum: 100
  insecureSkipTLSVerify: true
  service:
    name: metrics-server
    namespace: kube-system
  version: v1beta1
versionPriority: 100Once all the above are installed, we can start using the metrics collected by Metrics Server. A maximum of 5 minutes is required for the metrics server to be initiated and function properly after installation.
Viewing Metrics
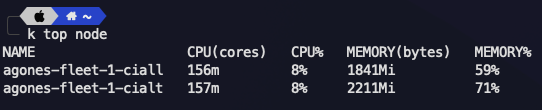
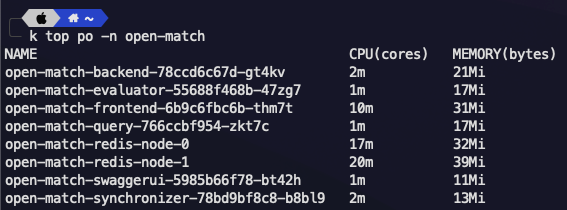
The Metrics Server will monitor the pods and nodes and update their metrics every 15 seconds. Its output for both pods and nodes can be viewed using the following commands:
For Nodes
kubectl top node
For Pods
kubectl top po
Deploying the Auto Scaler
The Horizontal Pod Autoscaler (HPA) takes input from data provided by the Metrics Server to scale applications up and down according to the thresholds mentioned in the YAML Manifest.
Save and deploy the HPA YAML provided below.
apiVersion: autoscaling/v1
kind: HorizontalPodAutoscaler
metadata:
  name: node-autoscaler
spec:
  scaleTargetRef:
    apiVersion: apps/v1
    kind: Deployment
    name: nginx
  minReplicas: 1
  maxReplicas: 10
  targetCPUUtilizationPercentage: 50
This is the YAML Definition for HPA. It works in the following ways:
scaleTargetRef: Details for the deployment to be scaledMin Replica: Minimum number of pods to be keptMax Replica: Maximum number of pods to be deployedtargetCPUUtilizationPercentage: Specifies the Load Threshold when load value exceeds the threshold, new replicas are added and vice-versa.
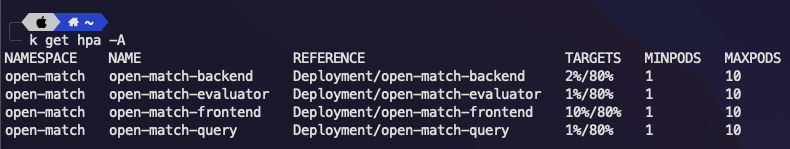
We can check for deployed HPA's by using the following command:
kubectl get hpa
Simulating User Traffic
To simulate user traffic, we can use different tools depending on the technology used by the application. Apache AB can be used for HTTP/HTTPS-based Web applications, and Artillery can be used for socket.io-based Web applications.
Detailed Guide on using these tools are linked below:
apt-get install apache2-utilsWe'll use Apache AB to simulate traffic:
ab -n 1000 -c 100 https://localhost:3000/
This command sends 1000 requests at the rate of 100/s to the endpoint specified.
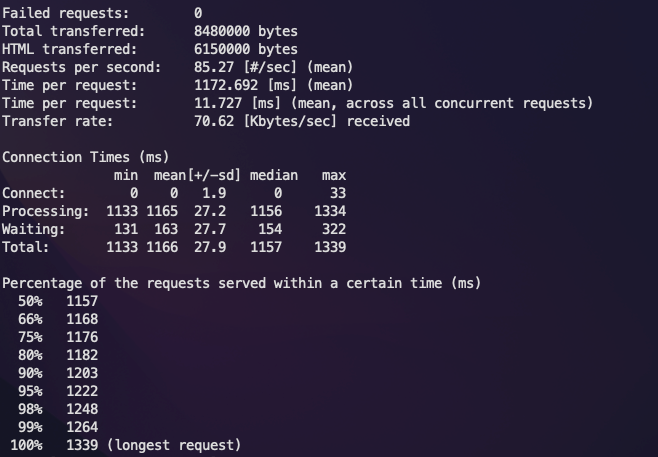
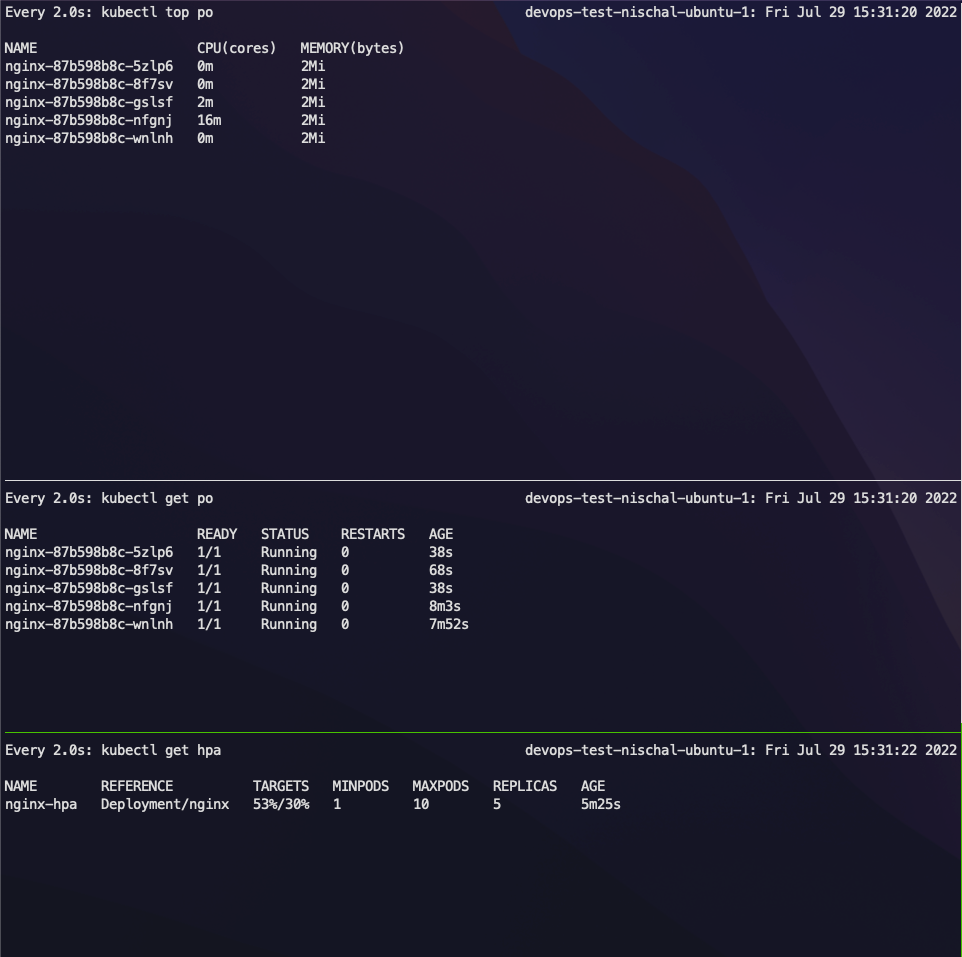
Let's check the status of the HPA.
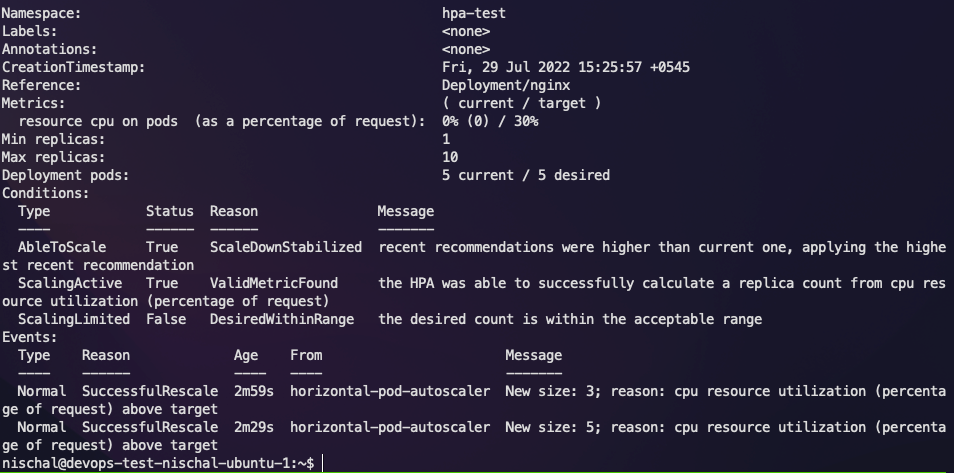
Now let's check how many new replicas have been added.
After Apache AB finishes the test, we can check the status of the HPA.
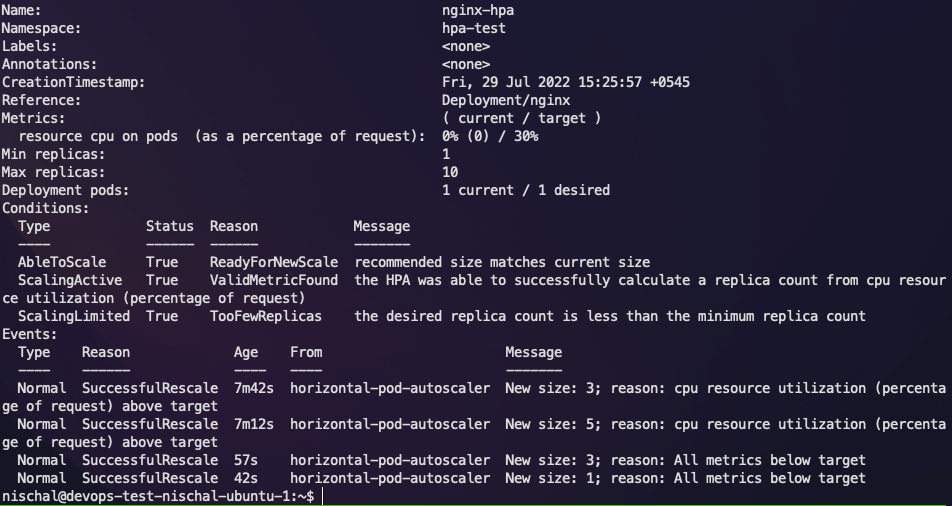
According to the HPA status, the applications should have scaled down now.
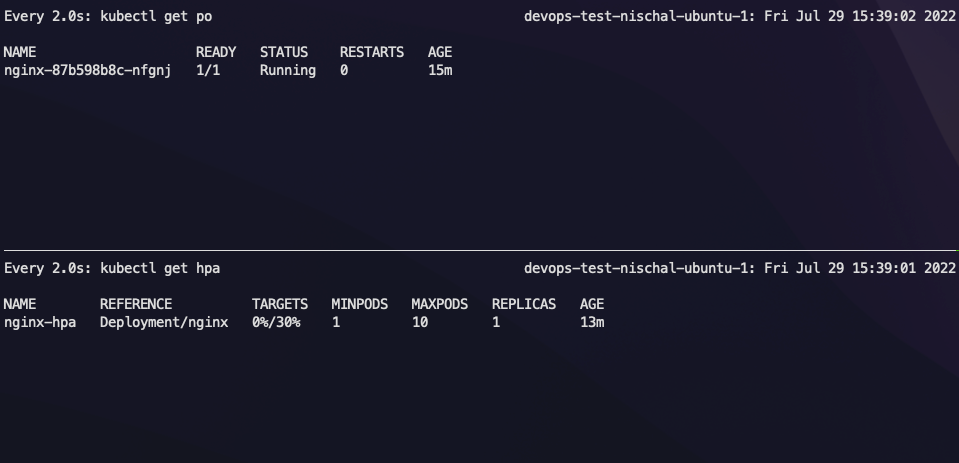
So in this way, we can scale our applications up and down according to user load.
Another component, the Vertical Pod Autoscaler (VPA), works by increasing the POD CPU/RAM request and limits. This is very different from HPA, which actually provisions more pods to handle the requests rather than increasing the amount of CPU/RAM provided to the pods.
Troubleshooting
Application Not Scaling
- The application you've deployed may not be receiving the requests being sent due to a misconfigured service.
- The HPA threshold may have been set too high and may take some time to start scaling.
- HPA doesn't work instantly. It takes a few seconds before starting the scale up/down.
Apache AB Load Test Error
You may face an error regarding an invalid URL. Check the URL and Port (Copy Paste from browser works best).
/ in the end. Otherwise, it will not recognize it.Conclusion
We've now installed Metrics Server in the Cluster, deployed Horizontal Pod Autoscaler and successfully load-tested the application using Apache AB.
By the end of this three-part tutorial, you should be able to dockerize a web application, deploy it into Kubernetes, perform load testing and implement autoscaling mechanisms.
It's recommended to test the limits of a single pod before deploying an HPA so that you know the threshold upon which the application performance is bottlenecked due to the lack of resources.
Doing so makes the scaling resource-efficient and cost-effective.
This much for this series on Dockerizing and Deploying to Kubernetes. Stay tuned for more! Subscribe and leave a comment below.