
Previously, we delved into the basics of Tshark, getting familiar with capturing packets and reading *.pcap files. In this article, we will learn some more.
Overview of the *.pcap files
Let's start with capinfos to get a brief overview of the pcap file.
Time range and number of packets
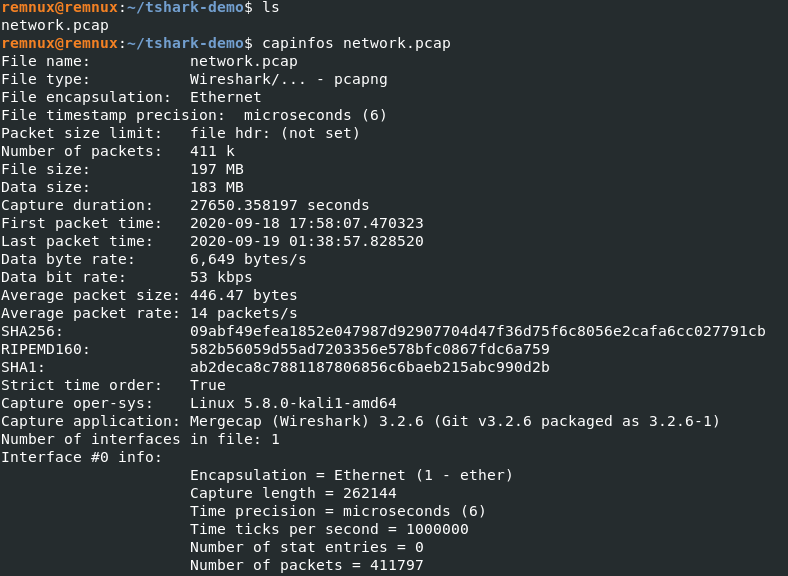
The result shows us the time range of the packets captured. This is important as we need to ensure the network traffic captured during the incident to analyze. The other important detail is the number of packets. In our case, it's >400k which is a lot. We can use various tools to filter out unnecessary noise and traffic to help investigate, one of them being Snort but it is currently out of the scope for this article.
Monitoring Statistics
Before diving into analysis, check what kind of traffic has been captured using the following command:
$ tshark -Q -r network.pcap -z io,phs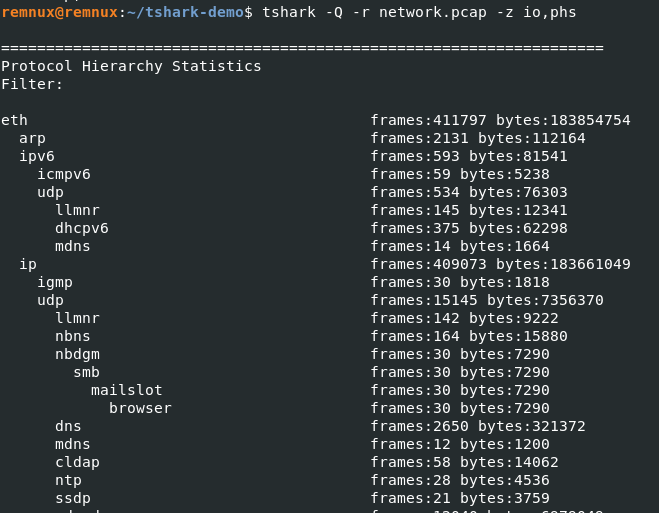
The -z flag is useful to collect statistics and display them in an orderly fashion. We can get all the endpoints in a pcap file.
To capture IPv4 endpoints:
$ tshark -r network.pcap -z endpoints,ip
To capture IPv6 endpoints
$ tshark -r network.pcap -z endpoints,ipv6
From the result, we also get information on which endpoint was most active during the incident.
Traffic Management
Reordering packets before beginning any form of analysis is recommended because Tshark does not reorder by default unlike Wireshark.
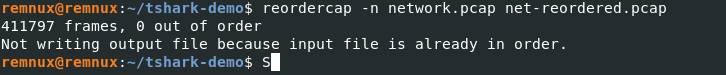
reordercapDifferentiating the traffic
As the traffic we captured has over 400k packets, the file contains a mixture of traffic from both known and unknown external devices. So, the first thing to do is ensure whether the traffic is normal. We can gather some host information to start.
$ tshark -r network.pcap -Y "dhcp" -e ip.src -e eth.dst -e eth.src_resolved
DHCP traffic might not always be available on the captured packets. In that case, we can also use NBNS (Net BIOS Name Service) traffic to identify the hosts, their Netbios name, associated IPs etc.
NetBIOS Name Service (NBNS) is a part of the NetBIOS-over-TCP protocol suite whose purpose is similar to that of DNS i.e. to translate human-readable names to IP addresses.
$ tshark -r dhcp2.pcap -Y "nbns" -Tfields -e ip.src -e eth.src_resolved -e nbns.name | sort | uniq
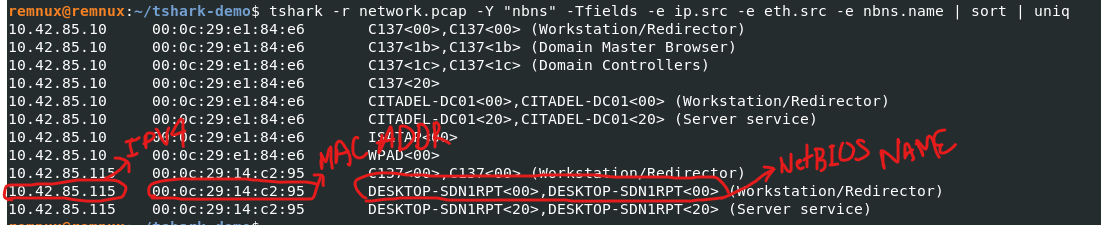
With this information, we will now be able to differentiate between the traffic generated by the known device and the unknown device to some extent.
Detecting the unknown host
Often, the traffic we capture will have an unknown host probing our network to identify live IP addresses. One of the ways to detect such activity is to look for ping sweep attempts.
$ tshark -r network.pcap -Y "icmp.type8 and icmp.code0" -Tfields -e ip.src | sort | uniq
Ping sweep is one of the simple ways to identify alive hosts. This method sends ICMP echo requests to multiple hosts and waits for ICMP echo replies to identify alive hosts.
If you want to generate ping sweep traffic to analyse, you can use NMAP with -sn flag i.e. nmap -sn <ip>. However, network administrators often block ICMP echo requests from external sources making this host discovery method unreliable.
Other display filters to identify such host discovery traffic are:
ARP Scan : arp.dst.hw_mac==00:00:00:00:00:00
IP Scan : icmp.type==3 and icmp.code==2
TCP Ping Sweep : tcp.dstport==7
UDP Ping Sweep : udp.dstport==7
Detecting Port Scans
Earlier, we found that someone had tried to discover alive hosts on our network. Their next step would be to find the open ports on alive hosts. So, we will search for such attempts.
tshark -r network.pcap -Y "tcp.flags.syn1 and tcp.flags.ack0 and tcp.window_size<=1024"
We are filtering out the TCP packets with SYN flag set but not ACK and fewer sizes than 1024 bytes. This is the first step in the TCP "three-way handshake" to establish a connection between hosts.
If you want to generate such traffic for analysis, you can do so using NMAP with -sS flag i.e nmap -sS <target's ip>
The results show that the IP which tried to detect our alive hosts has also scanned our network for open ports. We can now move on with the further detailed investigation tracing its footprints, finding out who went where, and finding out if any of our internal systems are reaching out to unknown remote systems, etc. We will go through them in the next article, so stay tuned.
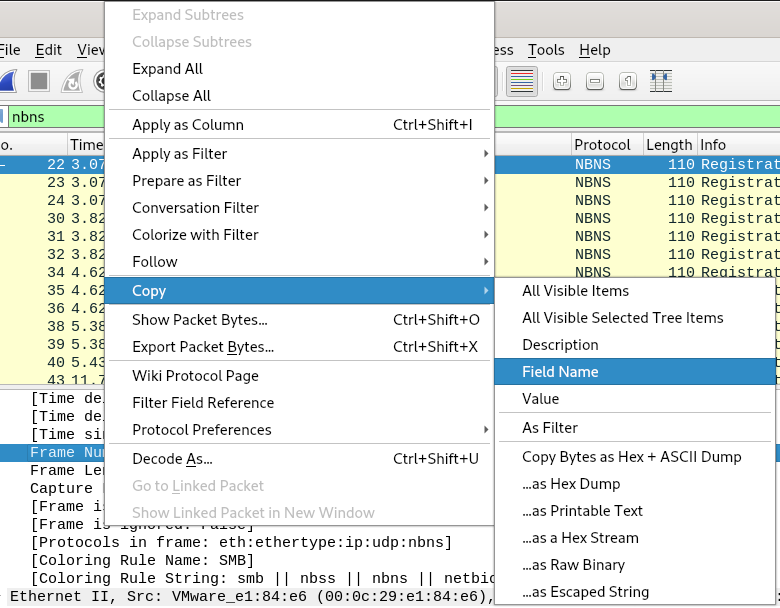
Tshark Field Guide
If you are having trouble remembering or don't know which field to use for filtering out unwanted data, you can use Wireshark GUI to get started. Just right-click on the desired field and copy the Field Name. Wireshark also has a vast reference of display fields available for free on its website.
Detecting different Nmap scans
Nmap allows users to scan the host using different methods depending on the situation. Some scan methods are TCP Connect, TCP Syn, TCP Ack, Fin, Xmass, UDP. In the above example, we filtered out the TCP Syn Scan using a display filter specifically meant for that scan. The above filter would be obsolete if the scan was done using a different method. For that, I have listed different display filters that should be used to filter out different kinds of traffic.
UDP Port Scan
Generate UDP traffic using Nmap: nmap -sU <target>
Display filter to identify UDP port Scan: icmp.type==3 and icmp.code==3
TCP Connect
Nmap Command to initiate TCP Connect Scan: nmap -sT <target's>
Display filter to identify TCP Connect Scan: tcp.flags.syn==1 and tcp.flags.ack==0 and tcp.window_size>1024
TCP NULL
Nmap Command to initiate TCP Null Scan: nmap -sN <target's ip>
Display filter to identify TCP Null Scan: tcp.flags==0
TCP FIN Scan
Nmap Command to initiate TCP Fin Scan: nmap -sF <target's ip>
Display filter to identify TCP FIN Scan: tcp.flags==0x001
TCP Xmass Scan
Nmap Command to initiate TCP Xmass Scan: nmap -sX <target's ip>
Display filter to identify TCP Xmass Scan: tcp.flags.fin1 && tcp.flags.push1 && tcp.flags.urg==1
Hope you liked it!! Please subscribe and leave comments if you have any query.