
Tshark is a terminal-based network protocol analyser. It's a handy program when you need to dump and analyse network packets but do not have access to GUI.
This article will highlight the basic use cases of Tshark.
Installation
Like most tools, Tshark comes preinstalled with pentesting distros like kali and parrot. If you don't have Tshark preinstalled, you can install it as follows.
On Linux
Tshark is a part of Wireshark, so the Tshark commands will be available if you install Wireshark.
# debian based distros
sudo apt install wireshark

# fedora
sudo dnf install wireshark
If you just want to install Tshark and do not need Wireshark GUI, then you can install it with:
sudo apt install tsharkTo run Tshark and Wireshark as a non-root user.
$ sudo dpkg-reconfigure wireshark-common
$ sudo usermod -a -G wireshark $USER
On Mac
brew install --cask wiresharkOn Windows
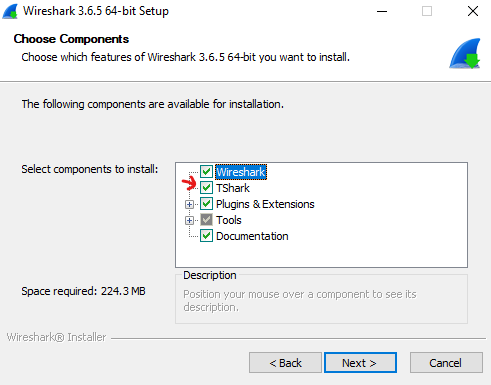
Download the Wireshark installer from here. Make sure to tick the TShark package while installing.
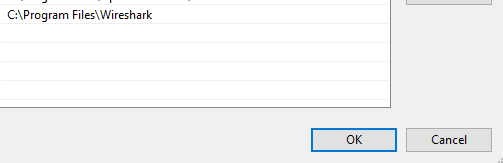
Once installed, copy the path and add it to the PATH environment variable as shown below.
- Select Install Path
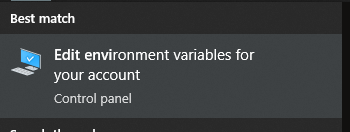
- Search your start menu for "Edit environment variables for your account".
- Edit Path.
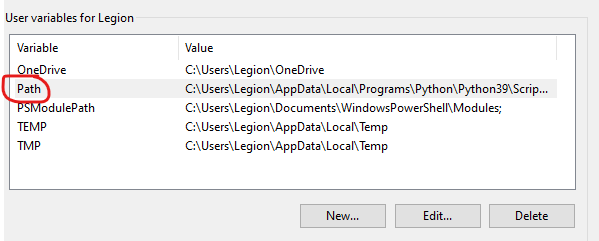
- Hit OK to save the modified PATH environment.
Once PATH is set, run TShark to check if everything works correctly (you need to restart the cmd shell first).

Basics
Capturing Packets
tshark -i <interface_name>While interface name should be enough, there are multiple ways to use -i
Using Interface Number
We can also use the interface number to select the interface.
tshark -i <n>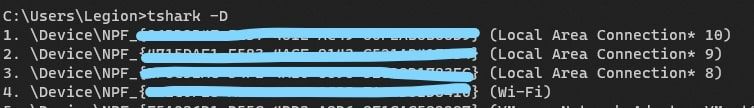
Reading From a Named Pipe
Create a named pipe.
mkfifo tsharkfifo
Then, specify the named pipe using the -i argument to read from it.
tshark -w tsharkfifo & tshark -i tsharkfifoFilter Packets
Use -f to filter packets according to type (ports, hosts, port range, etc.), transfer direction (source aka SRC, destination aka DST), and protocols (TCP, ICMP, UDP, ARP, etc.) Examples.
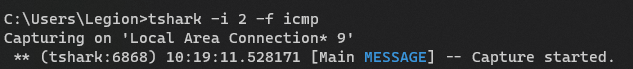
- Capture only ICMP
tshark -i 1 -f icmp- Capture the packet whose source port is 80
tshark -i -f 'src port 80'You can also build a complex expression using and, or, and not ( "&&", "||", and "!" )
- Example: Capture TCP or ICMP and ignore UDP
tshark -i 1 -f 'tcp or icmp && !udp'Read/Write the Capture to a File
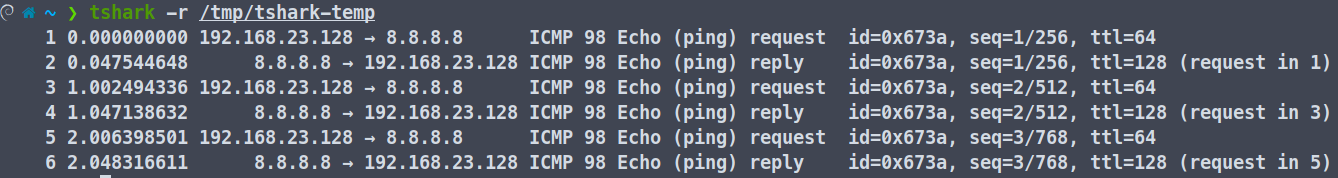
By default, tshark creates a temporary .pcapng file if no output is specified. You can save the output to a file using a -w <file_name>.
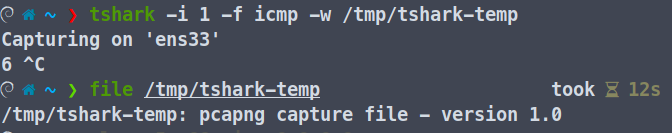
Then, you can read the file using -r <file_name>.
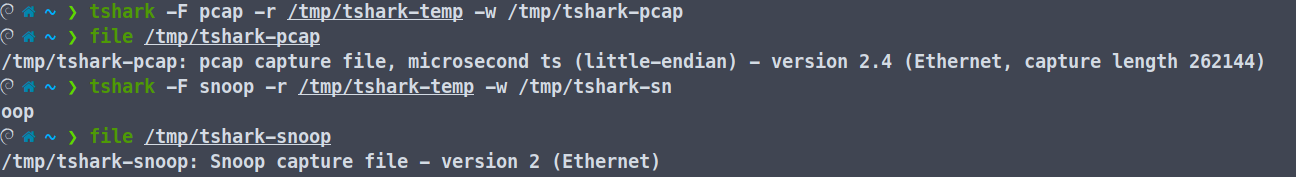
You can also specify the output formats using -F <desired-format>. Some of the formats supported by tshark are:
  5views
  commview
  erf
  k12text
  lanalyzer
  modpcap
  netmon1
  netmon2
  nettl
  ngsniffer
  ngwsniffer_1_1
  ngwsniffer_2_0
  niobserver
  nokiapcap
  nsecpcap
  pcap
  pcapng
  rh6_1pcap
  snoop
  suse6_3pcap
  visual
You can change the save format as follows as well.
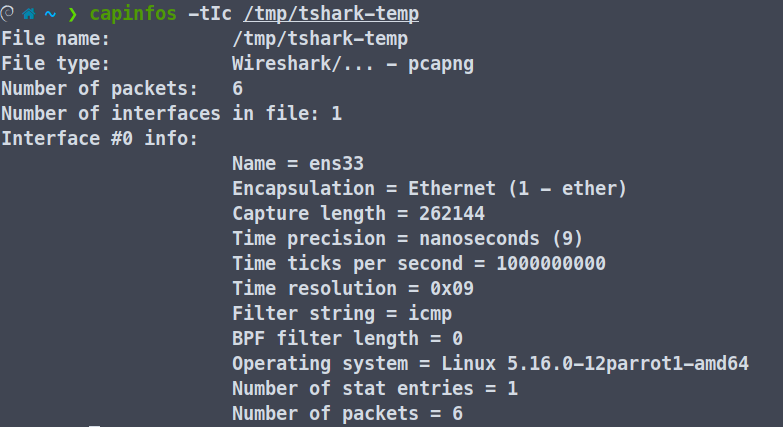
Analysing Pcap Files
You can use capinfos to get the metadata of a capture file. It has a total of 22 options to print specific Elements i.e -acdDeEFHiIkKlnosStuxyz. Go through the man page to know more about it.
Display Filters
Similar to Wireshark GUI, we can utilise display filters on tshark to filter the packets on our display. To use the display filter feature, you need to use -Y 'display_filter' cmd argument.
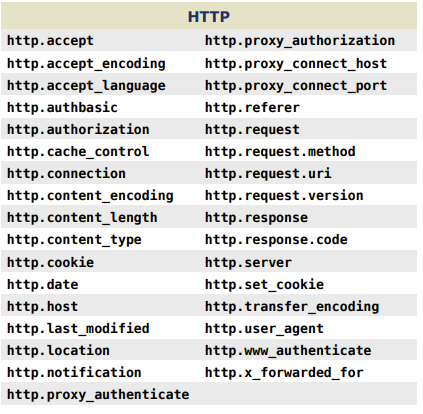
We will extract the data from HTTP requests from a pcap file using the above reference.
First, use -Y to specify we want the HTTP requests, -Tfields to specify we want to extract fields, and finally -e to specify the fields we want.

Similarly, if we want to extract an ICMP echo request, we can use the following display filters.
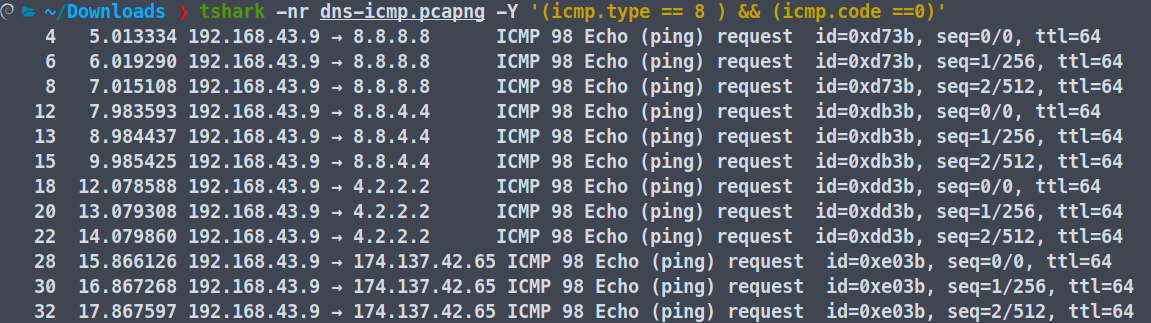
Refer to this page to know more about ICMP type and Code IDs.
Following Stream
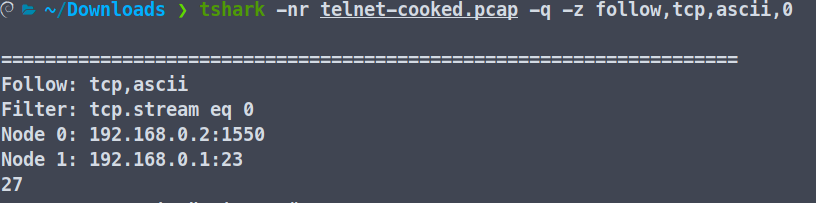
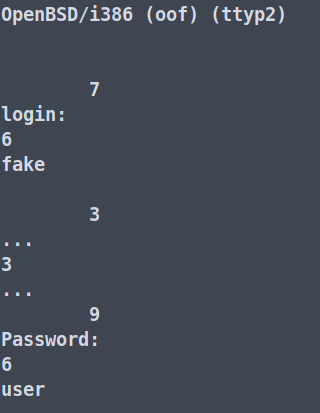
You can also follow the TCP stream using Tshark. To do that, we will have to use the following command.
tshark -r filename.pcap -q -z follow,tcp,ascii,0
Here, the -r is to specify the capture file, -q for a quiet output, and -z follow,tcp,ascii,0 for displaying the contents of the first TCP stream in ASCII format.
The general syntax for this is -z follow, protocol (TCP, UDP, HTTP2, etc) , mode ( ascii, ebcdic,hex,rax), filter(ip,stream-index).
These are only the very basic features of a TShark. You can do a lot more with it. Stay tuned to learn more about it.