
There are many cool things in Unity that we might not know unless someone tells us about them. These handy shortcuts and tools help us work and speed up our Unity Workflow.
Today, we will discuss five such tools and shortcuts in this blog.
1. Interface Tools Shortcuts
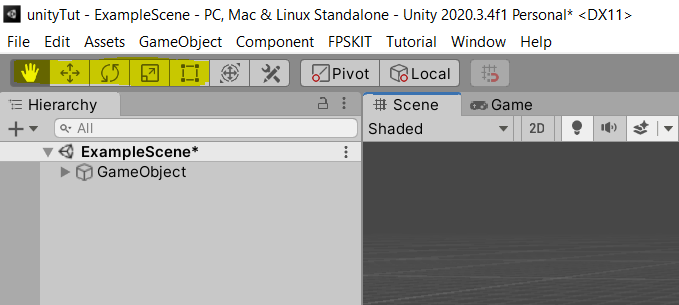
Below the menu bar, we can see Unity's Interface Tools. The five elements in yellow highlight are hand, move, rotate, scale, and rect tool, respectively. They are used to set up game objects in-game in scene mode, and their shortcuts are
- Q, for hand,
- W, for move,
- E, for rotate,
- R, for scale,
- and T for rect.
2. Hover Shortcuts
Now it's time to hover over the scene and see whether every game objects are in perfect position and rotation or not. The shortcut for it is to press the right mouse button and use the keys A, W, S, and D. We can also combine this shortcut with the Shift key to increase movement speed. With these keys, we can move forward or backwards with respect to our current mouse direction.
If you press the Right mouse button and move the mouse, the view will be rotated with respect to the mouse.
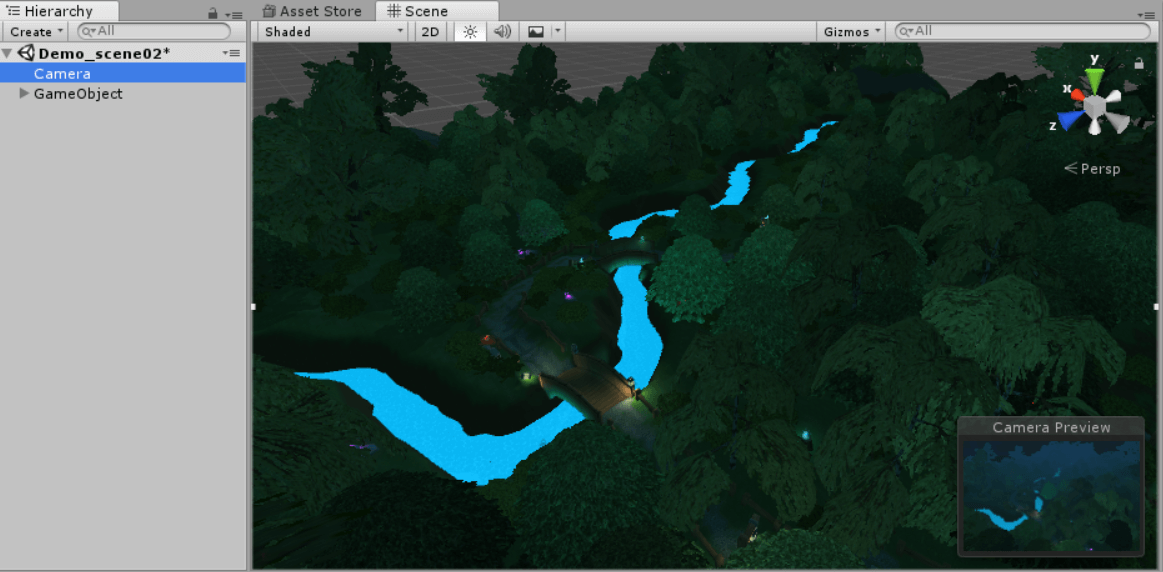
3. Camera View Shortcuts
Without knowing the shortcuts to camera view, positioning the camera can be difficult.

This is our current game view. Our camera is placed so that it renders the scene like this. If we want to change the camera position and rotation to the desired view, we go to Scene Mode and move around using the Hover Shortcuts mentioned in the previous tip.
Finally, we can see our desired view in scene mode that is supposed to be rendered by the camera.

We can now select the camera in the hierarchy and press Ctrl + Shift + F.
4. Unity Stats
We can see the performance of our game in the game window when it is playing with the Unity Stats overlay.
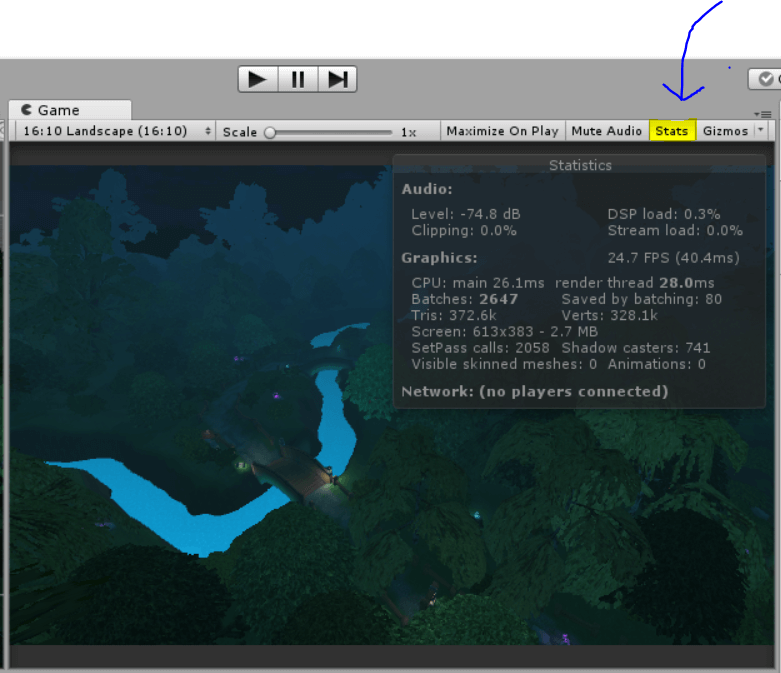
Press the Stats button in the game window, and a grey stats window will appear. Here, we can see the FPS and the number of batches and vertices in-game.
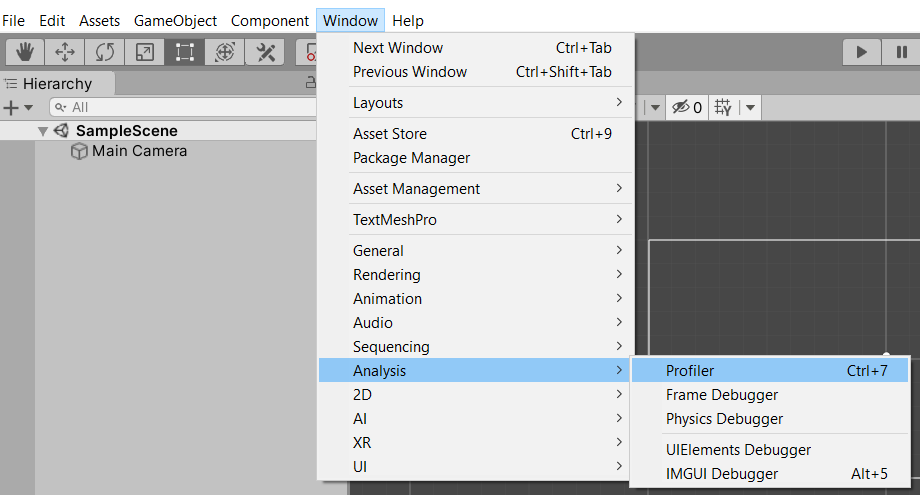
5. Unity Profiler
The Unity Profiler is an analysis tool provided by Unity where we can observe memory usage by different components in our game. We can see which code or part of our game is creating spikes, and then we can take the necessary steps to overcome our problem.
We can open the Profiler by clicking on Window > Analysis > Profiler.
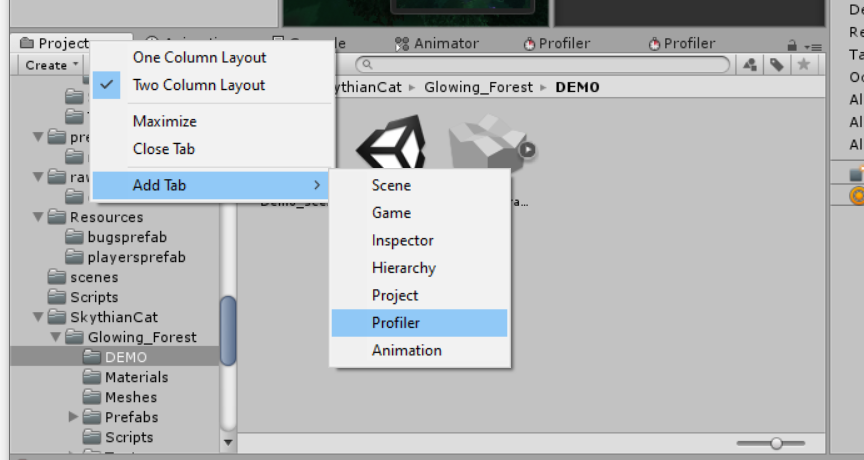
Or, in older versions of Unity, we can open the Profiler by right-clicking on Project and then going to Add Tab > Profiler.
Now we will see a new Profiler window. Here we can observe detailed information about our game in every frame.
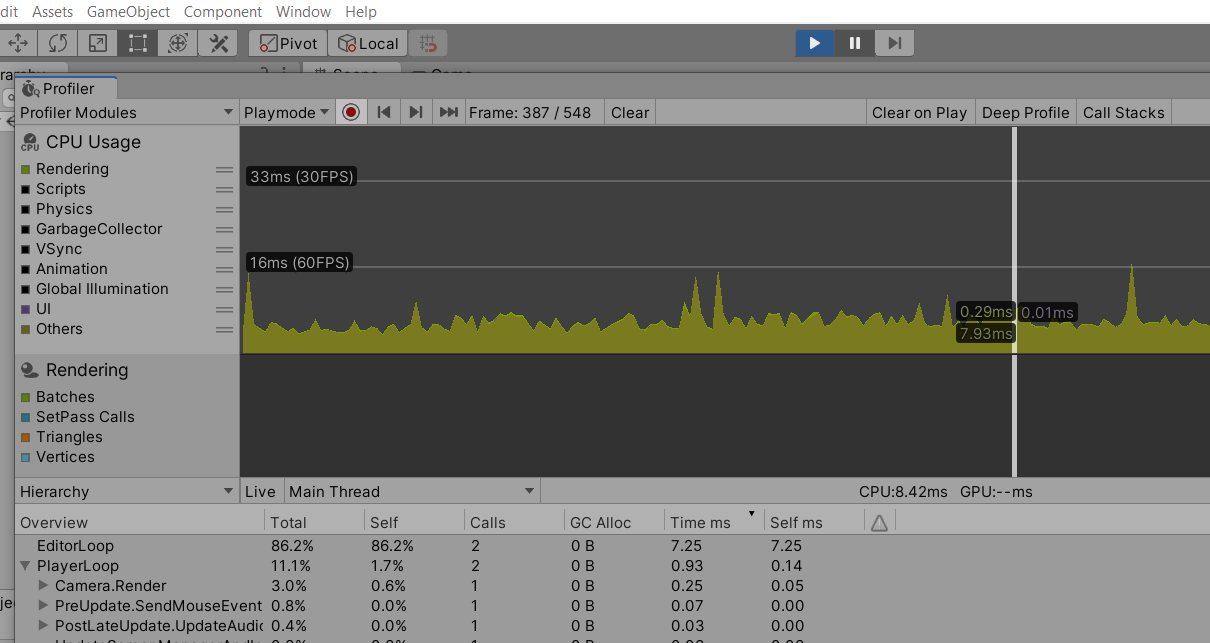
The next part of the blog will talk about all the data in the Profiler window, so stay tuned!
I hope these tips were helpful for you and improved your workflow in Unity.