
Introduction
Centralized logging is key to effectively managing and troubleshooting distributed systems. This is where the powerful trio of Grafana, Loki, and Promtail comes into play. They offer a scalable, flexible, and efficient way to gather, store, index, search, and visualize log data.
Promtail is like your personal log collector. It gathers logs from various parts of your infrastructure and prepares them for Loki, tailoring them to Loki’s specific needs before sending them off for storage and indexing. Promtail is quite versatile, supporting different log formats and protocols, making it great for collecting logs from various applications, services, and systems.
You can set up Promtail to scrape logs from files, system logs, Docker containers, Kubernetes pods, and more. It can even label logs on the fly based on file path, contents, or other attributes, which makes organizing and querying logs in Loki a breeze. Plus, it has some pretty cool features like log relabeling, multiline log support, and client-side rate limiting, making it adaptable to various logging environments.
Next up is Loki, the heart of the logging pipeline. Loki is designed to efficiently handle high volume of logs while providing fast and cost-effective storage. It stores logs in a highly compressed, indexed, and structured format, which optimizes query performance and resource utilization.
What sets Loki apart is its unique architecture that uses labels for log indexing. This allows for efficient querying based on various dimensions like time, severity, source, or even custom labels defined by users. This label-based approach enables precise filtering and aggregation of log data, helping users quickly extract actionable insights from their logs.
Loki’s distributed nature allows it to scale horizontally, handling growing log volumes effortlessly. It supports high availability configurations, ensuring data reliability and durability. Plus, it integrates seamlessly with Grafana for visualization, enabling users to create rich dashboards and alerts based on log data.
Last but not least, Grafana is the face of the operation. It’s the front end for querying, analyzing, and visualizing log data stored in Loki. Its user-friendly interface lets users create custom dashboards, explore logs interactively, and set up alerts based on specific log patterns or conditions. With Grafana’s powerful query language and visualization options, users can gain deep insights into system behaviour and performance.
Grafana’s integration with Loki provides seamless navigation between metrics and logs, giving a holistic view of system health and performance. Users can correlate log events with metric data to identify underlying issues and troubleshoot effectively. Grafana also supports templating and annotations, making collaboration and team documentation easier.
Benefits of Centralized Logging with Grafana, Loki, and Promtail
- Scalability: Thanks to their modular architecture, Grafana, Loki, and Promtail can scale horizontally to handle growing log volumes and infrastructure complexity.
- Flexibility: They support various log formats, sources, and protocols, ensuring compatibility with diverse logging environments and applications.
- Efficiency: They enable efficient log collection, storage, indexing, and querying, providing fast access to log data for troubleshooting and analysis.
- Visibility: Grafana’s rich visualization capabilities empower users to gain actionable insights from log data through interactive dashboards and alerts.
- Cost-Effectiveness: Loki’s optimized storage and indexing reduce storage costs while maintaining query performance and scalability.
Setting It Up
Now, let's set up the Logging Stack on your server. Follow the instructions given below to do so.
Save the files in the specified directories and their names in their caption text.
version: '3.9'

name: graf-logstack

services:

  grafana:
    image: grafana/grafana:10.0.3
    container_name: grafana
    ports:
      - 3005:3000
    volumes:
      - ./config/grafana-datasources.yaml:/etc/grafana/provisioning/datasources/datasources.yaml
      - grafana-data:/var/lib/grafana
    environment:
      - GF_DEFAULT_APP_MODE=development
      - GF_LOG_LEVEL=debug
    networks:
      - graf-net

  loki:
    image: grafana/loki:2.8.4
    container_name: loki
    ports:
      - 3100:3100
    volumes:
      - loki-data:/loki
      - ./config/loki-config.yaml:/etc/loki/local-config.yaml
    command: -config.file=/etc/loki/local-config.yaml
    networks:
      - graf-net

  promtail:
    image:  grafana/promtail:2.8.4
    container_name: promtail
    volumes:
      - ./config/promtail.yaml:/etc/promtail/docker-config.yaml
      - /var/lib/docker/containers:/var/lib/docker/containers:ro
      - /var/run/docker.sock:/var/run/docker.sock
    command: -config.file=/etc/promtail/docker-config.yaml
    depends_on:
      - loki
    networks:
      - graf-net

  nginx:
    image: nginx:alpine
    container_name: nginx
    ports:
      - 8000:80
    volumes:
      - ./src:/usr/share/nginx/html
    labels:
      logging: "promtail"
    networks:
      - graf-net

volumes:
  loki-data:
  grafana-data:

networks:
  graf-net:
    name: graf-net
compose.yml
apiVersion: 1

datasources:
  - name: Loki
    type: loki
    access: proxy
    url: http://loki:3100
    version: 1
    editable: false
    isDefault: true
config/grafana-datasources.yaml
auth_enabled: false

server:
  http_listen_port: 3100

common:
  path_prefix: /loki
  storage:
    filesystem:
      chunks_directory: /loki/chunks
      rules_directory: /loki/rules
  replication_factor: 1
  ring:
    kvstore:
      store: inmemory

schema_config:
  configs:
    - from: 2020-10-24
      store: boltdb
      object_store: inmemory
      schema: v11
      index:
        prefix: index_
        period: 24h

storage_config:
  boltdb:
    directory: /loki/index

compactor:
  working_directory: /loki/compactor
  shared_store: aws
  retention_enabled: true

chunk_store_config:
  max_look_back_period: 48h

limits_config:
  retention_period: 48h

table_manager:
  retention_deletes_enabled: true
  retention_period: 48h

analytics:
  reporting_enabled: false
config/loki-config.yaml
server:
  http_listen_port: 9080
  grpc_listen_port: 0

positions:
  filename: /tmp/positions.yaml

clients:
  - url: http://loki:3100/loki/api/v1/push

scrape_configs:
  - job_name: f_scrape
    docker_sd_configs:
      - host: unix:///var/run/docker.sock
        refresh_interval: 5s
        filters:
          - name: label
            values: ["logging=promtail"]

    relabel_configs:
      - source_labels: ['__meta_docker_container_name']
        regex: '/(.*)'
        target_label: 'container_name'
      - source_labels: ['__meta_docker_container_id']
        target_label: 'container_id'
config/promtail.yaml
<!DOCTYPE html>
<html>
<head>
<title>My Webpage</title>
<style>
body {
font-family: Arial, sans-serif;
margin: 0;
padding: 0;
background-color: #f0f0f0;
}
.header {
background-color: #333;
color: #fff;
padding: 10px;
text-align: center;
}
.content {
margin: 15px;
}
.footer {
background-color: #333;
color: #fff;
text-align: center;
padding: 10px;
position: fixed;
bottom: 0;
width: 100%;
}
/* Additional styling for buttons */
.button {
background-color: #4CAF50;
/* Green */
border: none;
color: white;
padding: 15px 32px;
text-align: center;
text-decoration: none;
display: inline-block;
font-size: 16px;
margin: 4px 2px;
cursor: pointer;
transition: transform 0.3s;
}
.button:hover {
transform: scale(1.1);
}
</style>
</head>
<body>
<div class="header"></div>
<h1>Welcome to My Webpage</h1>
</div>
<div class="content"></div>
<p>This is a simple webpage with basic styling.</p>
<!-- Adding some buttons -->
<button class="button" onclick="buttonClicked('Button 1')">Button 1</button>
<button class="button" onclick="buttonClicked('Button 2')">Button 2</button>
</div>
<div class="footer">
<p>Footer content goes here</p>
<p>© 2024 Your Company Name. All rights reserved.</p>
</div>
<!-- Adding some JavaScript -->
<script>
function buttonClicked(buttonName) {
alert(buttonName + ' was clicked!');
}
</script>
</body>
</html>src/index.html
Once all files are saved in their respective directories, run the following command:
docker compose -f compose.yml up -dThe above command will pull the docker images required and create containers for our logging solution.
Viewing the Logs
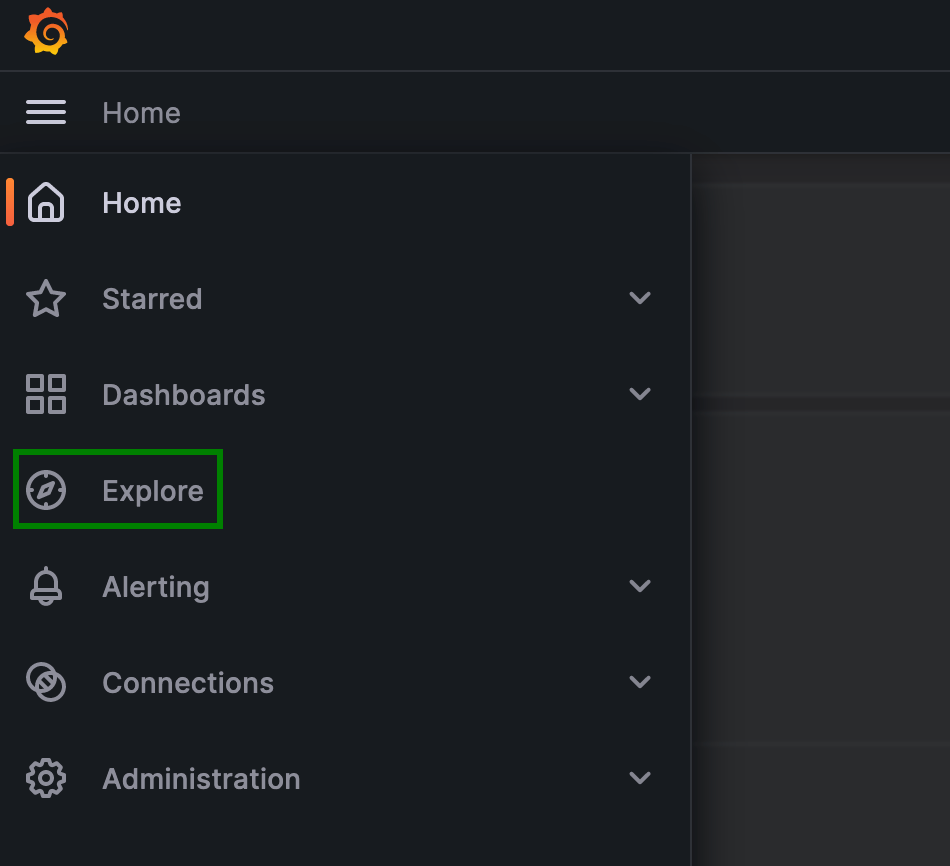
Once all containers are up, you should be able to access the Grafana instance at localhost:3005, go to the explore tab.
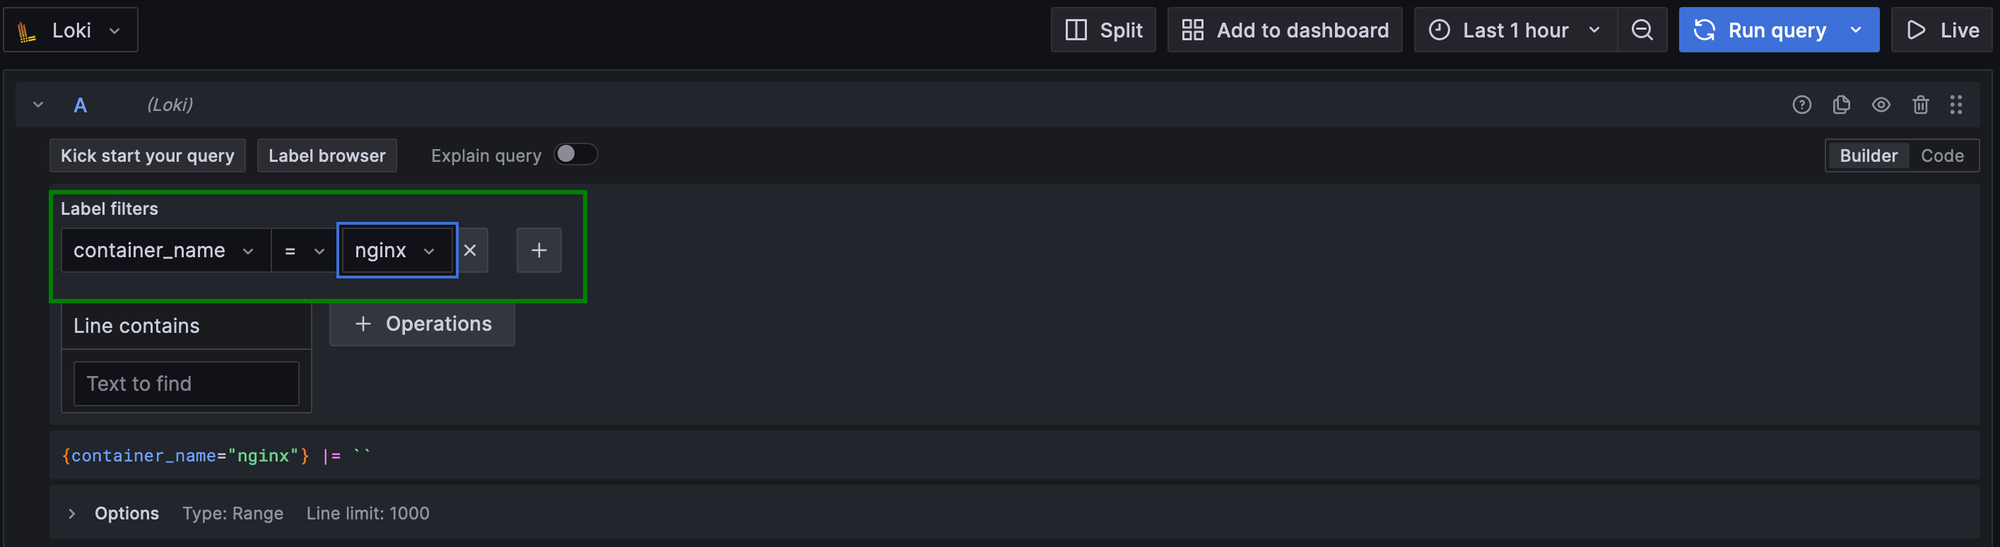
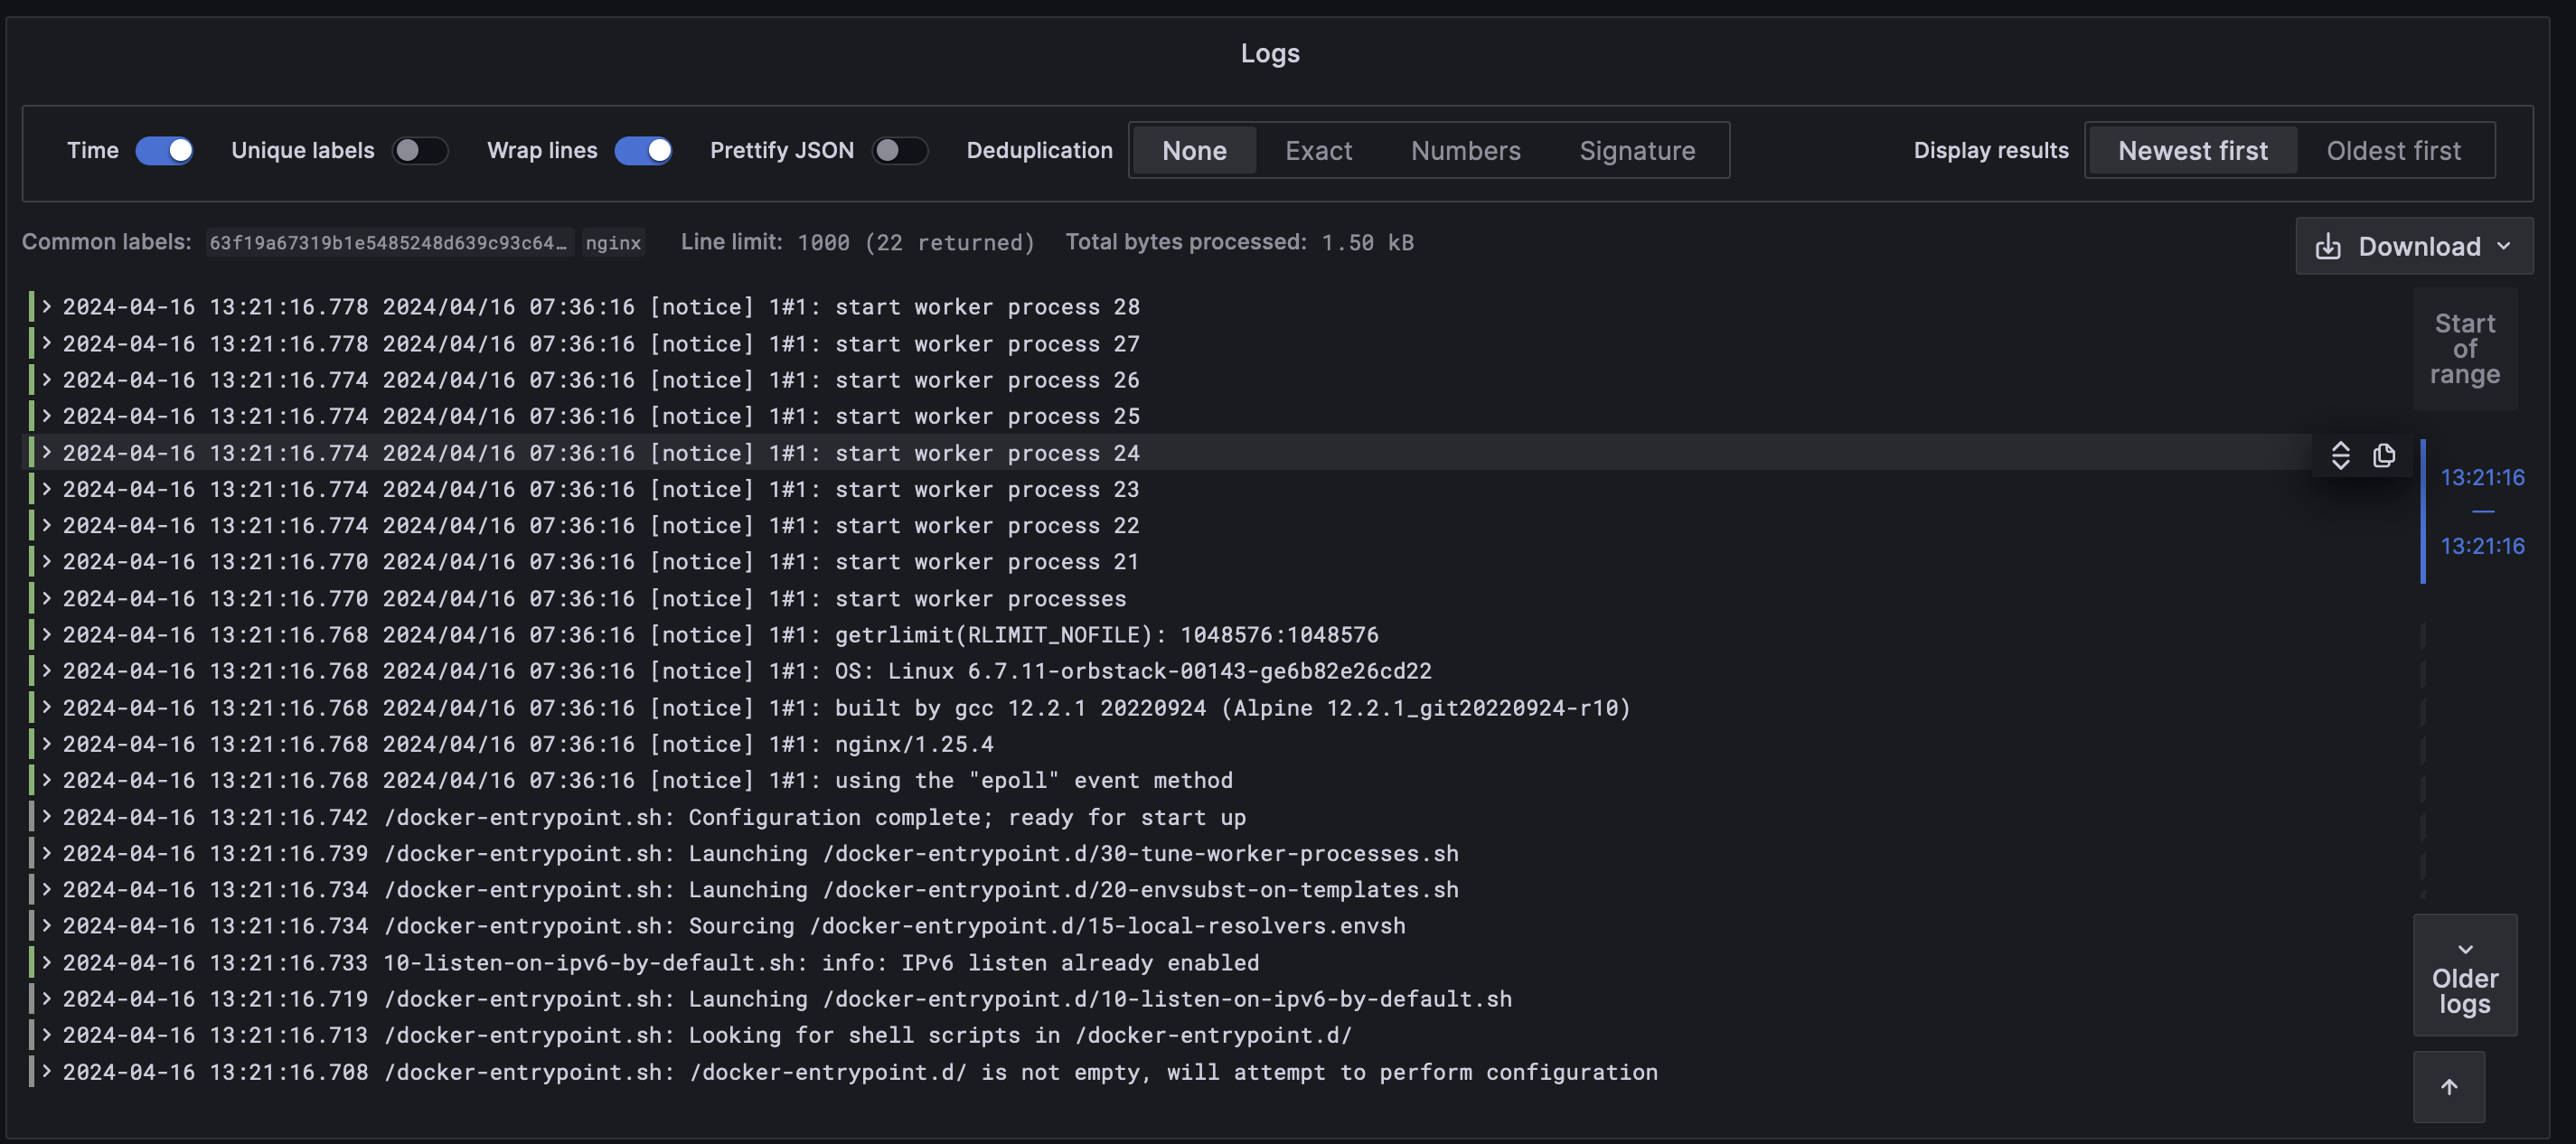
There, you can view the nginx container logs.
Conclusion
Centralized logging with Grafana, Loki, and Promtail offers a comprehensive solution for managing and analyzing log data in distributed systems. By leveraging their strengths, organizations can gain valuable insights into system behaviour and performance.
Thank You for reading, please comment below if you have any queries. I try to periodically update my articles to ensure legibility.