

While using Apache JMeter to test your application's performance, you will see plenty of components that help gather and analyze the results. One of the key components in that is the Listener. This blog explains listeners in JMeter and helps you understand the different types of Listeners available as simplistically as possible.
What is a Listener in JMeter?
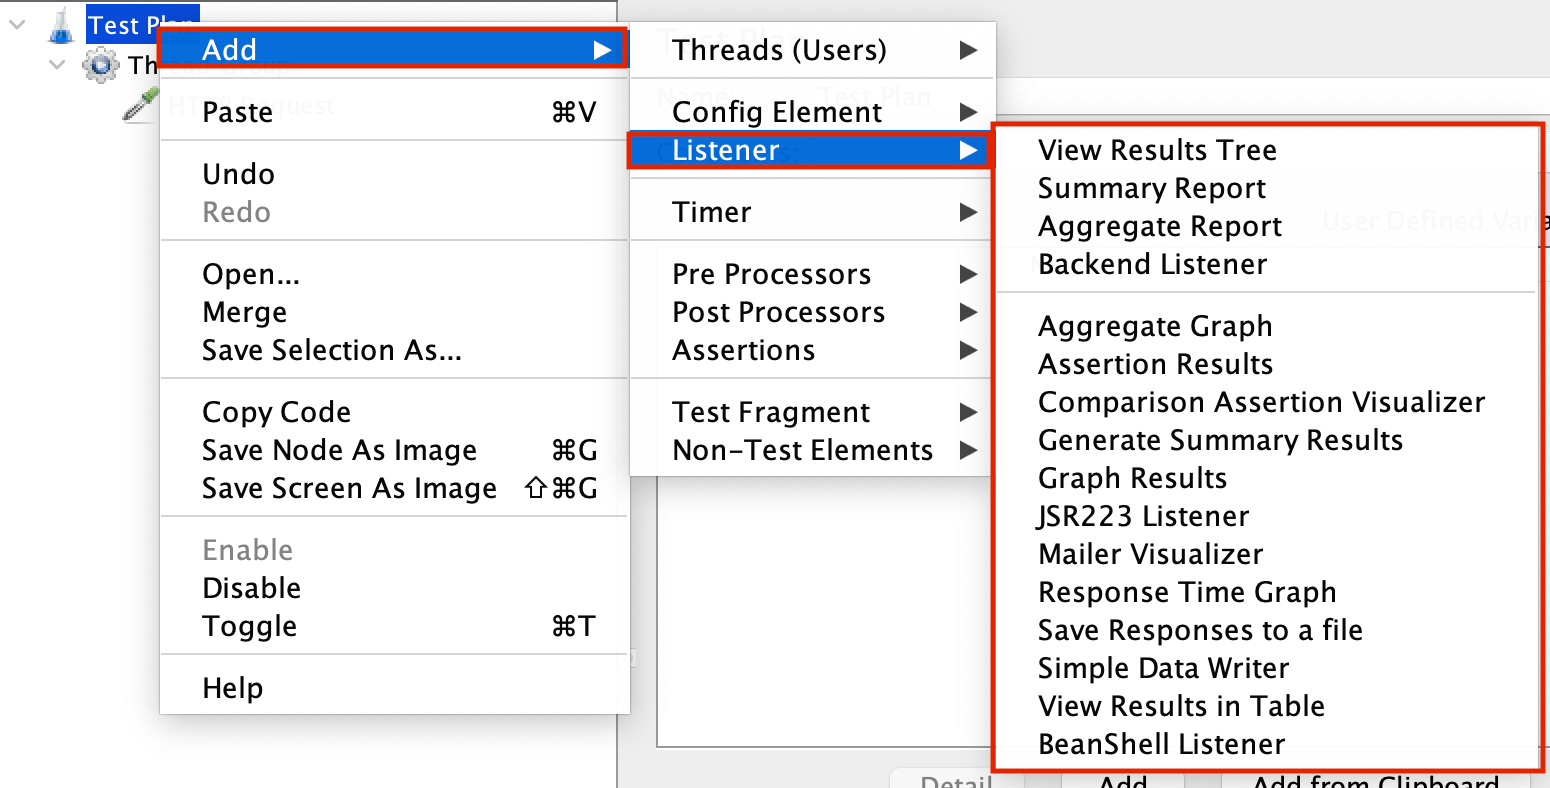
A Listener is a part of the component that receives and processes the result during Performance Testing. It fetches the information from your tests and presents it better, allowing you to easily analyze how your API is performing. Without listeners, you won’t be able to see the results of your test execution, though it keeps running, the results are not visible.
Why Are Listeners Important?
- They allow you to view test outcomes live or post-test.
- They offer different formats for displaying results.
- They help in analyzing performance metrics.
- They assist in identifying and troubleshooting performance issues.
Types of Listeners in JMeter
1. View Results Tree
The View Results Tree listener is one of the most popular and easy-to-navigate tools in JMeter. It presents results in a tree format, enabling you to examine the request and response data for each sample, including request and response headers. Detailed information about any errors that occurred during the test is also visible.
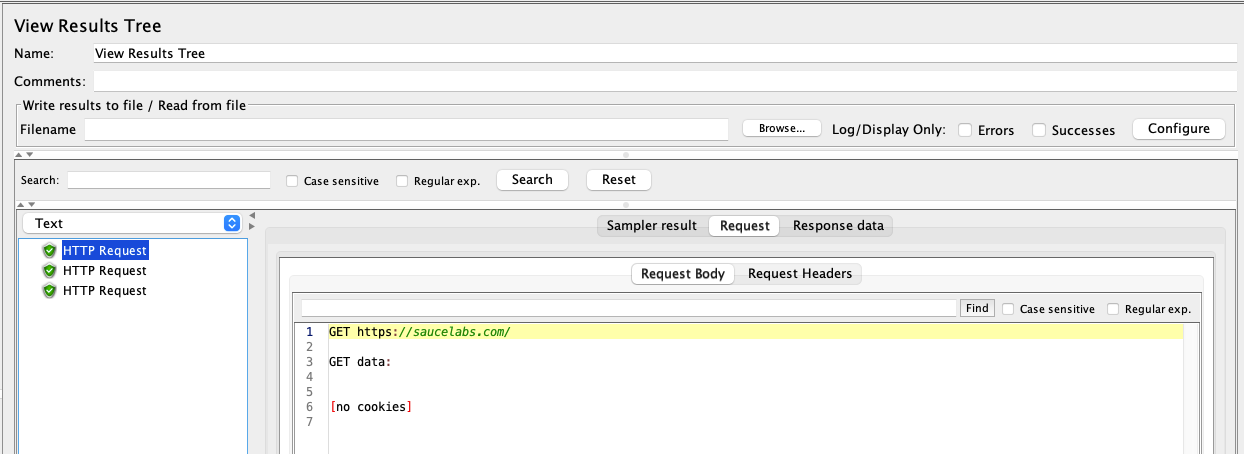
- Request Body: Shows the request type, URL, and data of the request sent.
- Request Header: Displays the headers included in the request.
- Response Body: Shows the data returned by the server.
- Response Header: Displays the headers received in the response.
2. Summary Report
The Summary Report listener gives a brief summary of the test results. It presents data in a table format, making it easy to understand your application's performance. The report includes key metrics such as the number of samples, average response time, minimum and maximum response times, and error percentage.
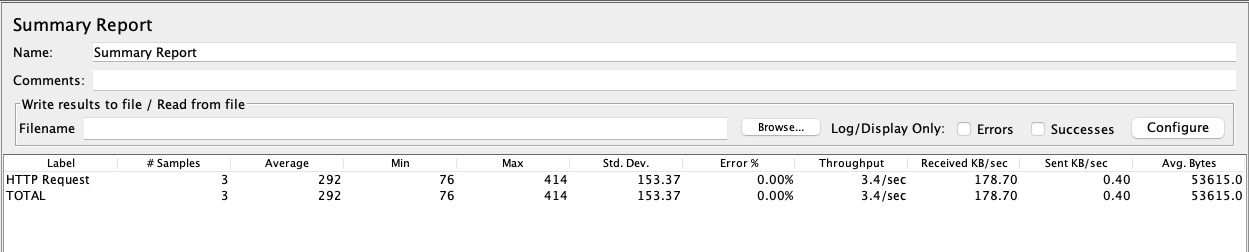
- Average: The average response time of all requests.
- Min: The shortest response time recorded for any request.
- Max: The longest response time recorded for any request.
- Standard Deviation: The measure of how much the response times vary from the average response time.
- Error %: The percentage of requests that resulted in errors.
- Throughput: Number of requests processed per unit time.
- Received KB/sec: Speed at which data has been received.
- Sent KB/sec: The rate at which data is sent in kilobytes per second.
- Average Bytes: The average size of responses received in bytes.
3. Aggregate Report
The only difference between the Aggregate Report and the Summary Report is statistical analysis. It provides an overview of various performance parameters and statistical details such as median response time, 90 percentiles, 95 percentiles etc.
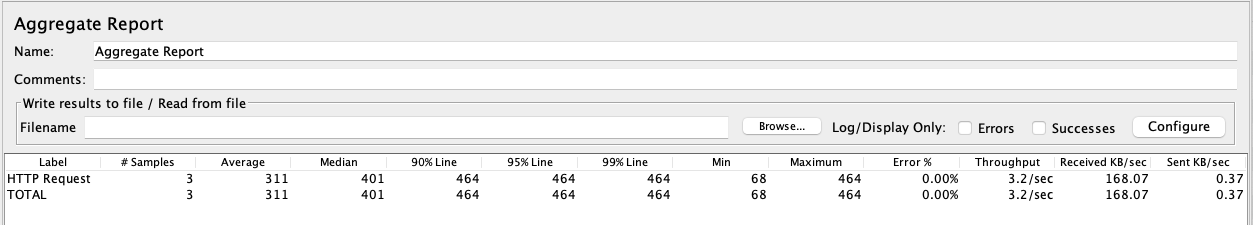
- Median: The response time at which half of the requests are faster and half are slower.
- 90% Line: The response time below which 90% of the requests are completed.
- 95% Line: The response time below which 95% of the requests are completed.
- 99% Line: The response time below which 99% of the requests are completed.
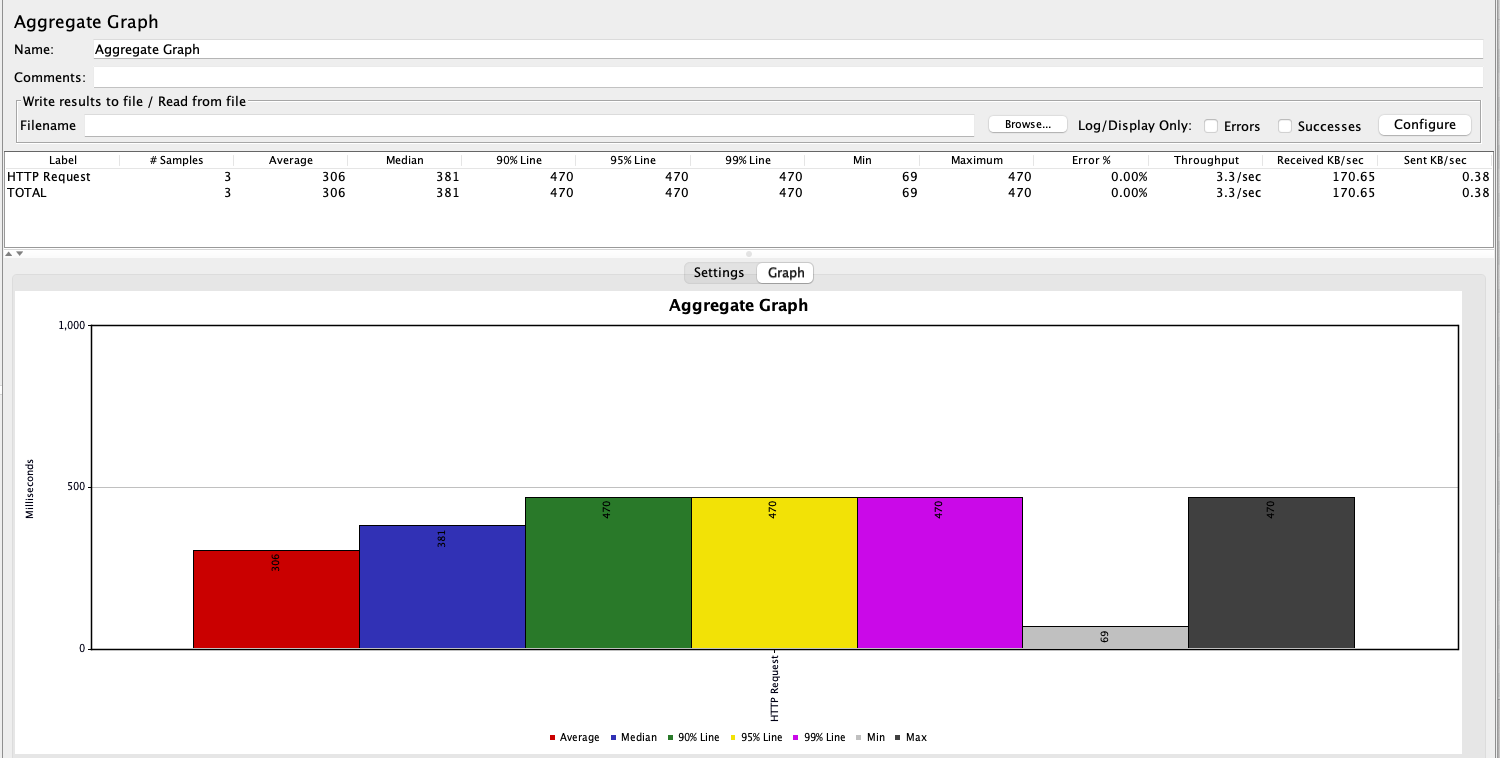
4. Aggregate Graph
The Aggregate Graph is the visual representation of the data generated through the Aggregate Report. The graph can be customized based on the data on the settings as needed.
Also Read: Samplers in JMeter
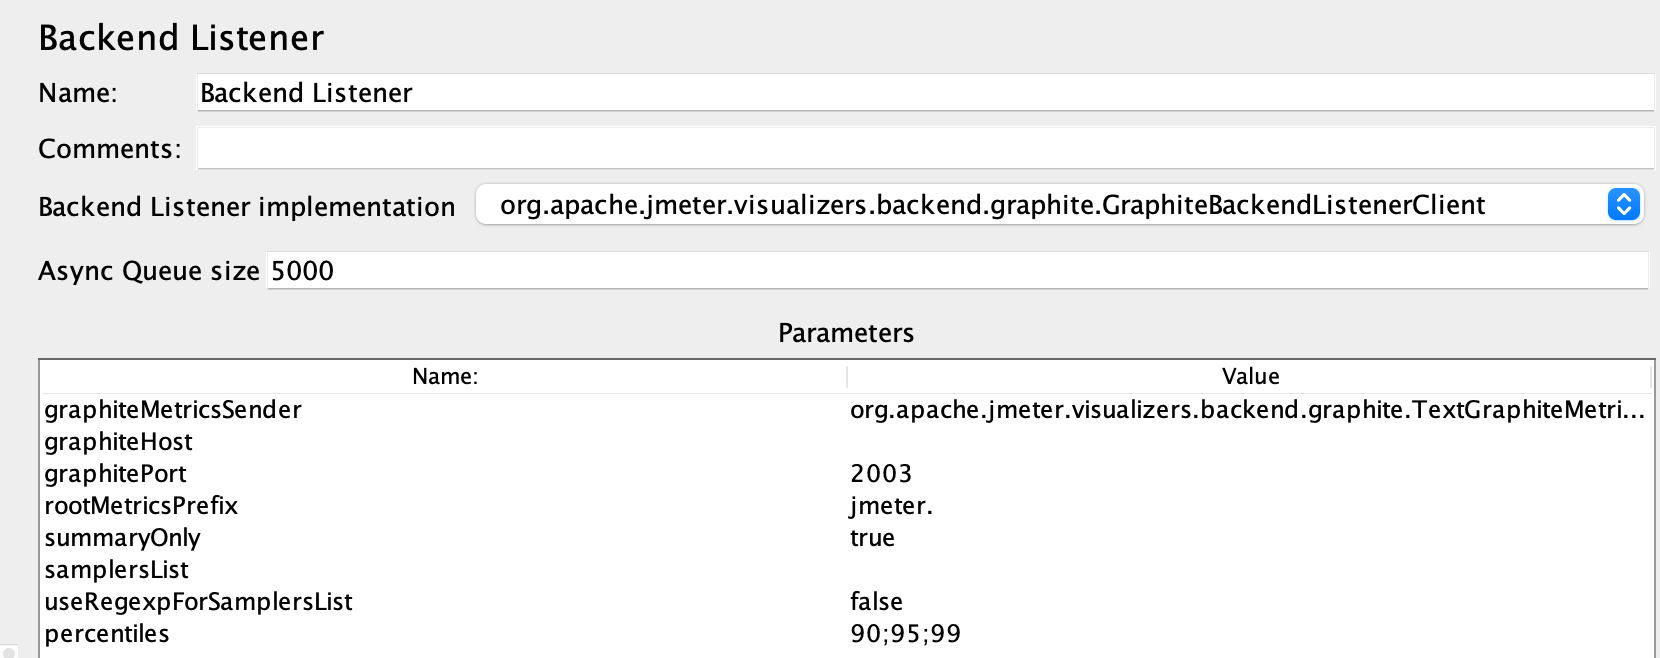
5. Backend Listener
The Backend Listener is a special listener that allows you to send results from your test runs to some external system instead of using local files. By doing this, you can measure performance data live and avoid possible bottlenecks in JMeter performances during heavy load testing that needs powerful hardware resources to consume more CPU and a real-time integration with an external analytics platform.
Types of Backend Listeners:
Some varieties of Back End Listeners Include:
- Graphite Backend Listener: Sends metrics to a Graphite server.
- InfluxDB Backend Listener: Sends metrics to an InfluxDB.
- Elasticsearch Backend Listener: Sends metrics to an Elasticsearch cluster.
6. Generate Summary Results
The Summary Results Listener in JMeter generates a summary report, which will be saved into the log file (output format depends on settings from the Jmeter properties file). The Summary Results Listener automatically logs these aggregated test results in a log file once the corresponding Jmeter completes its run. The properties file, you referred to, defines the output for these important metrics in a simple CSV format:
- Label: Name of the sampler.
- Samples: Total number of requests made.
- Average: Mean response time.
- Min: Minimum time for the response recorded.
- Max: The highest recorded response time.
- Std. Dev: Standard deviation of response times.
- Error %: Percentage of Requests failed.
- Throughput: Requests per second.
- KB/sec: Data transferred per second.
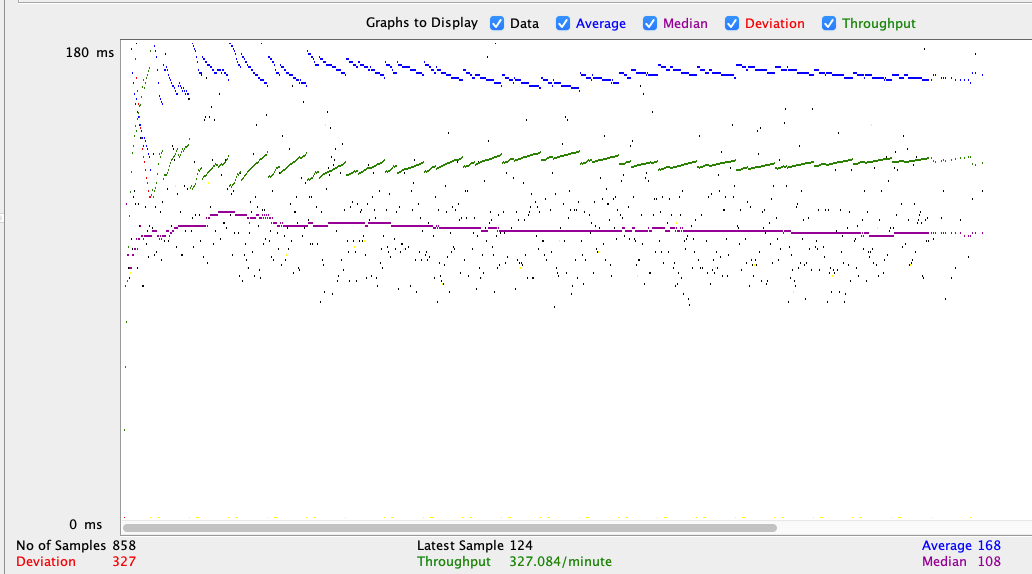
7. Graph Results
The Graph Results listener displays test results in graphical format. It generates charts that plot response times and throughput over time, allowing you to visualize trends and patterns. Helps in understanding performance trends and identifying spikes or drops in performance.
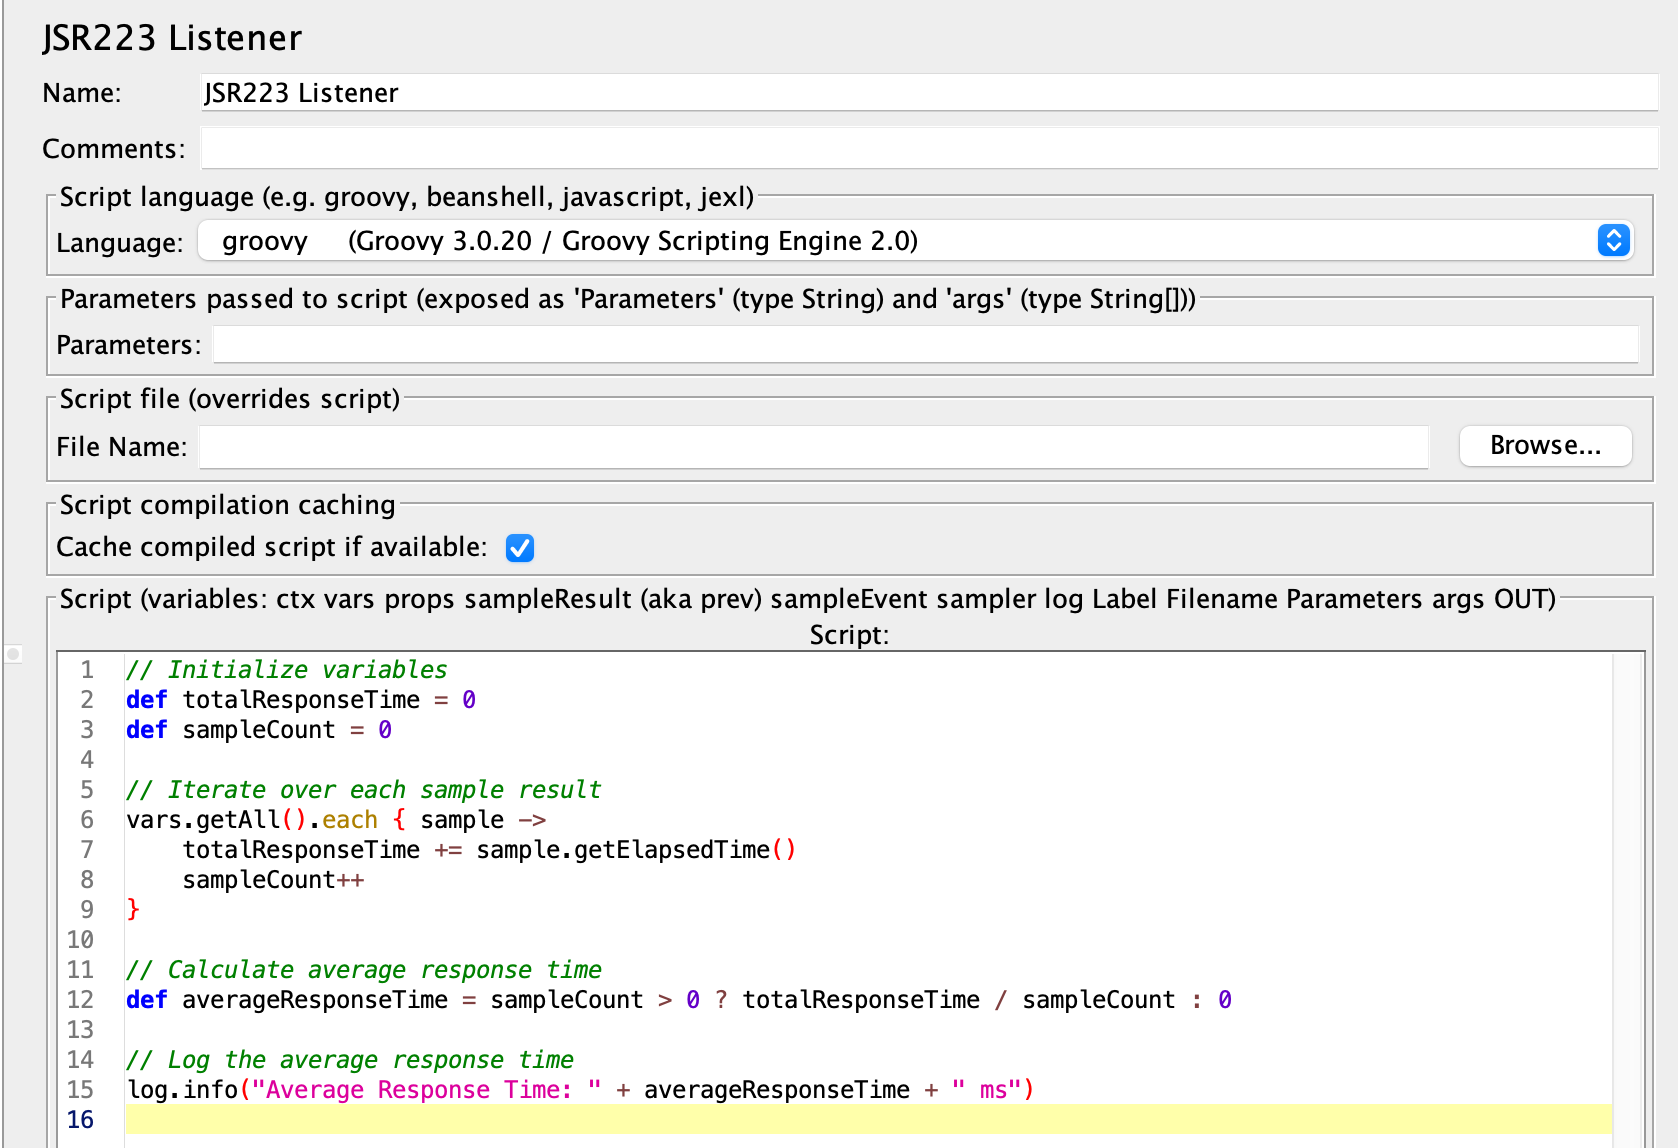
8. JSR223 Listener
The JSR223 Listener in Apache JMeter is a powerful tool for executing custom scripts during your test plan's execution, similar to the JSR223 Sampler but used primarily for post-test processing. While the JSR223 Sampler is designed to execute scripts as part of the test flow, allowing you to interact with test data and logic, the JSR223 Listener focuses on handling results after the test samples have been processed. Both components support scripting in languages like Groovy, JavaScript, and Jython, enabling advanced customization and manipulation of test data and results.
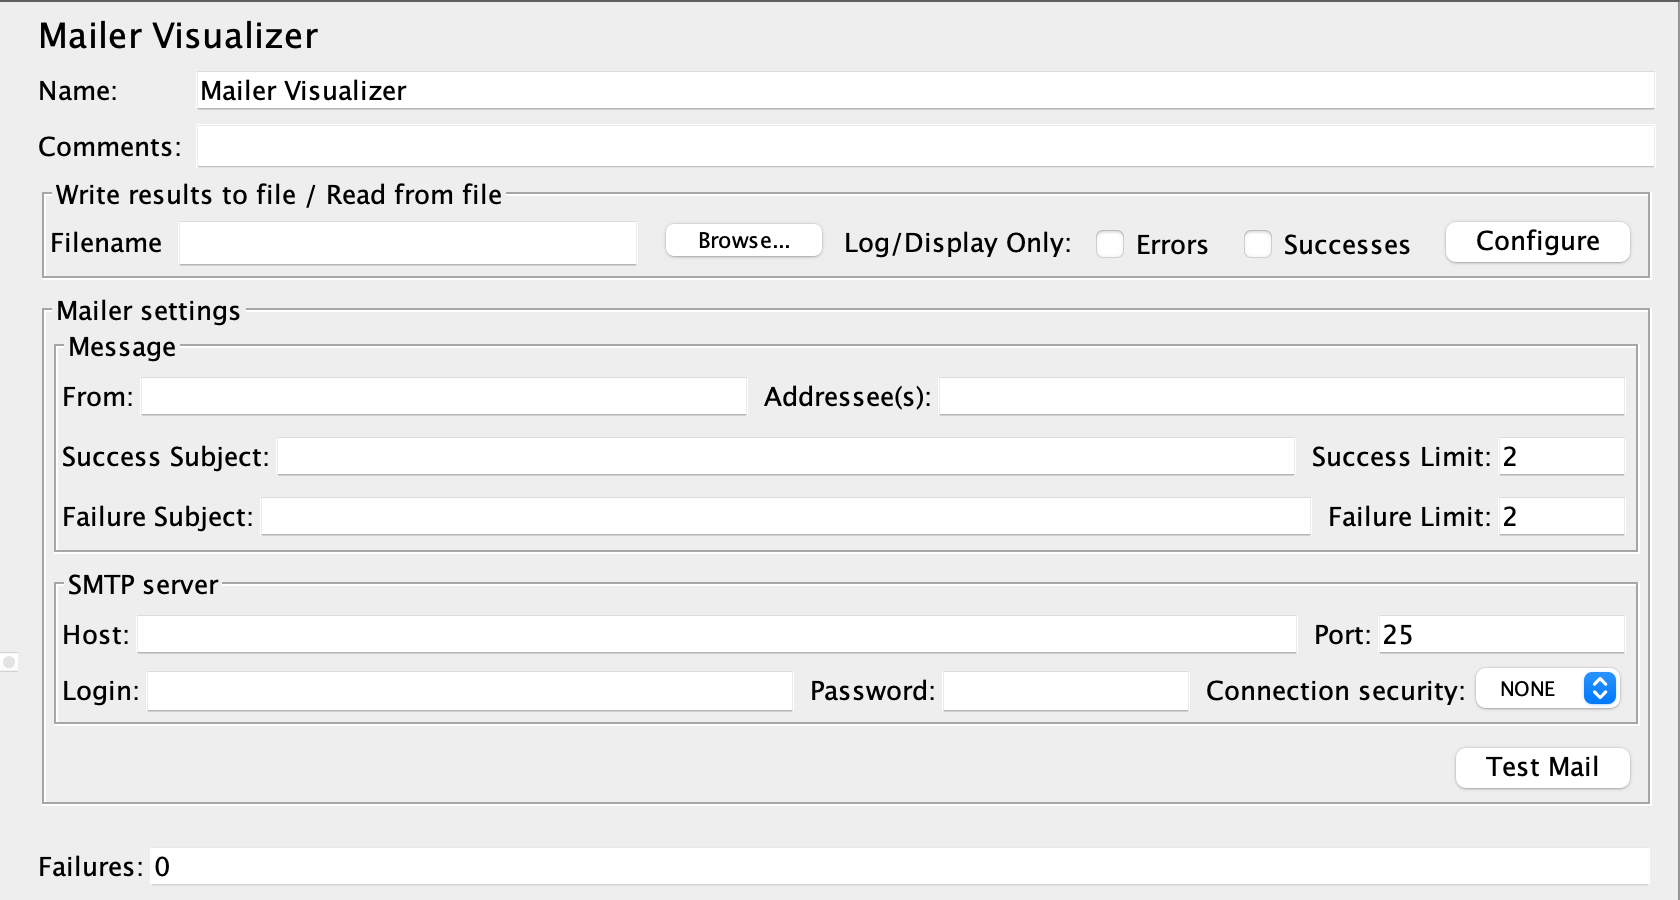
9. Mailer Visualizer
The Mailer Visualizer in JMeter allows you to send email notifications based on your test results. You can configure it to automatically send emails when a test completes, with customizable content like test summaries or alerts. By setting up the Mail Visualizer, you can specify your SMTP server details, the sender and recipient addresses, and the message content, which can include dynamic information from the test. This feature helps keep stakeholders informed and can be easily integrated into your testing process for automatic reporting.
Also Read: Getting started with Alt Tester : Automating Game Test
10. Response Time Graph
The Response Time Graph listener in JMeter is designed to visualize how response times fluctuate for a test. It creates a graph that visually shows the response time as it changes over each of testing, which can help make decision points much better. It is essential, especially when it comes to identifying time-dependent performance issues and analyzing how response times change throughout the test, so you can check for any particular period within a whole test.
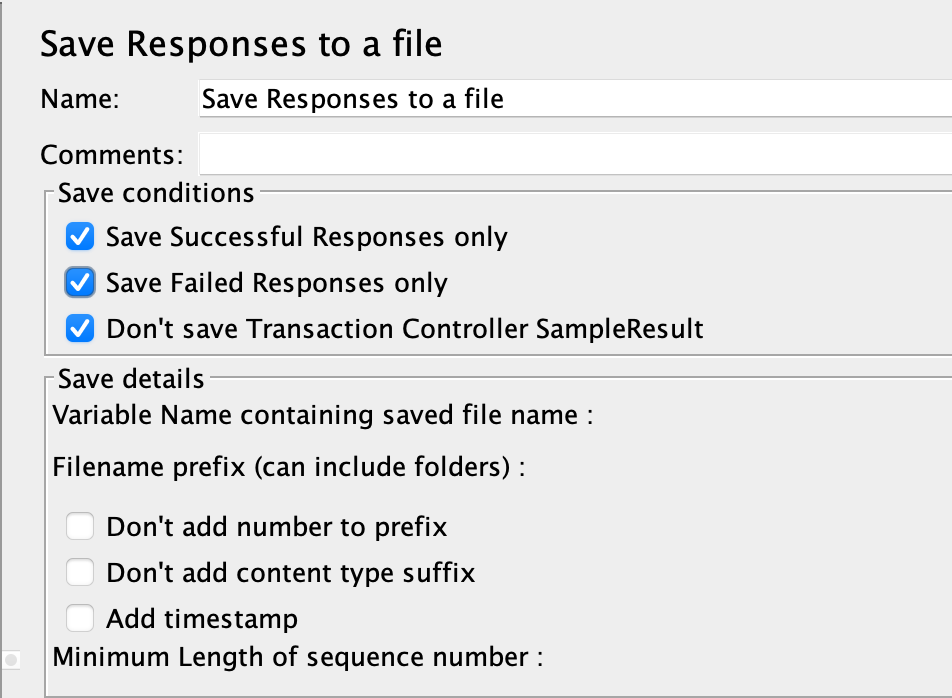
11. Save Responses to a file
To save responses to a file, you can use a Save Responses to a file listener to capture and store them based on different criteria. For example, responses can be categorized into failed and success, and you can choose specific fields to retrieve the relevant data. Saving these responses is useful for various reasons. Often, it can be challenging to pinpoint the reasons for failure immediately during execution. By saving the data, you can analyze it later to understand the causes of any failures.
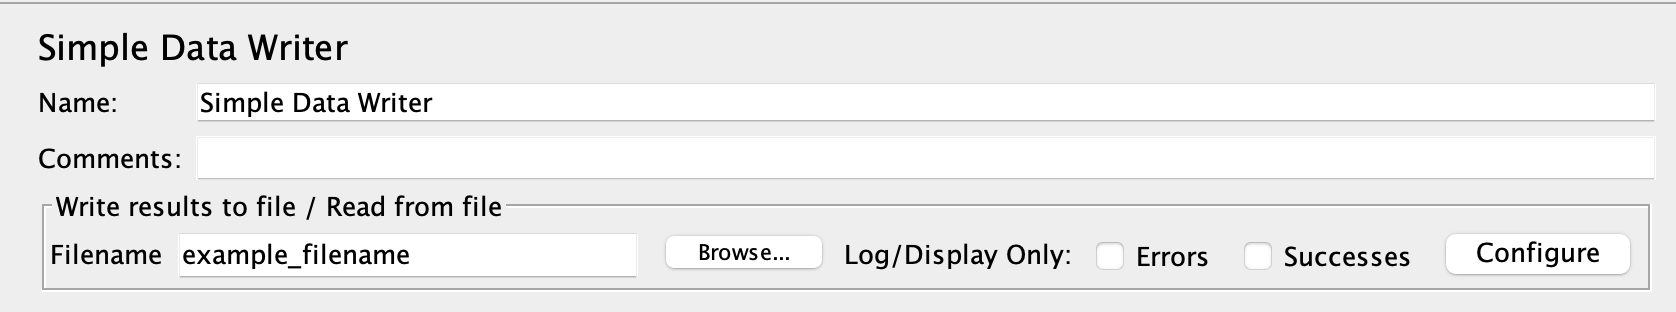
12. Simple Data Writer
The Simple Data Writer listener is a practical tool for saving test results to a file, offering a straightforward method for logging data that can be analyzed later. Key features include the ability to export test results in CSV format and its simplicity in setup and use, making it ideal for logging results without complex configurations. It is particularly useful when you need to preserve results for offline analysis, record-keeping, or exporting data for use with other tools or future reference.
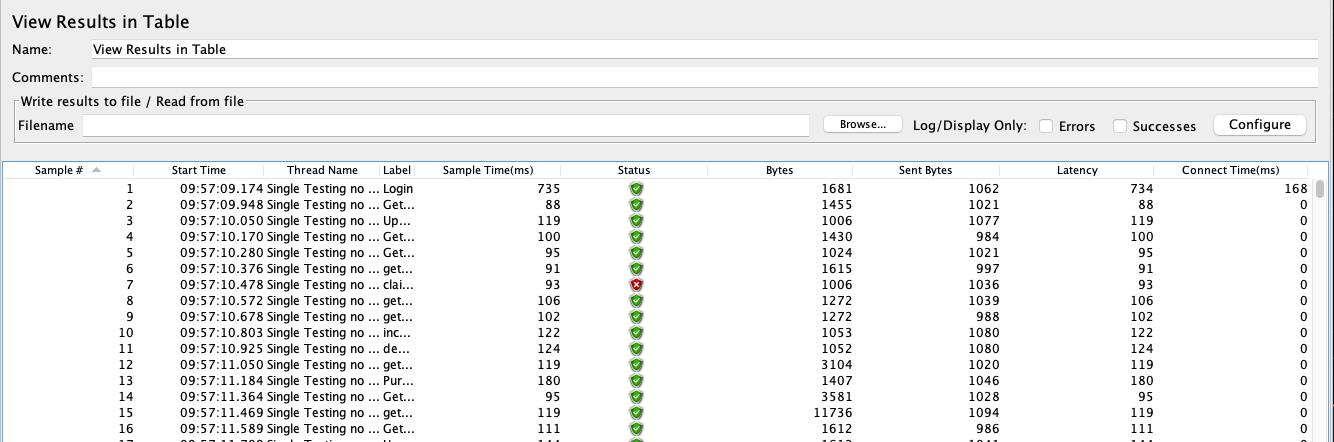
13. View Results in Table
The View Results in Table listener presents test results in a structured tabular format, offering a clear and organized display of detailed information for each sample. It effectively shows both request and response details in a table, making it ideal for obtaining a comprehensive view of test results. This listener is particularly useful when you need to examine specific data points and performance metrics in an orderly manner.
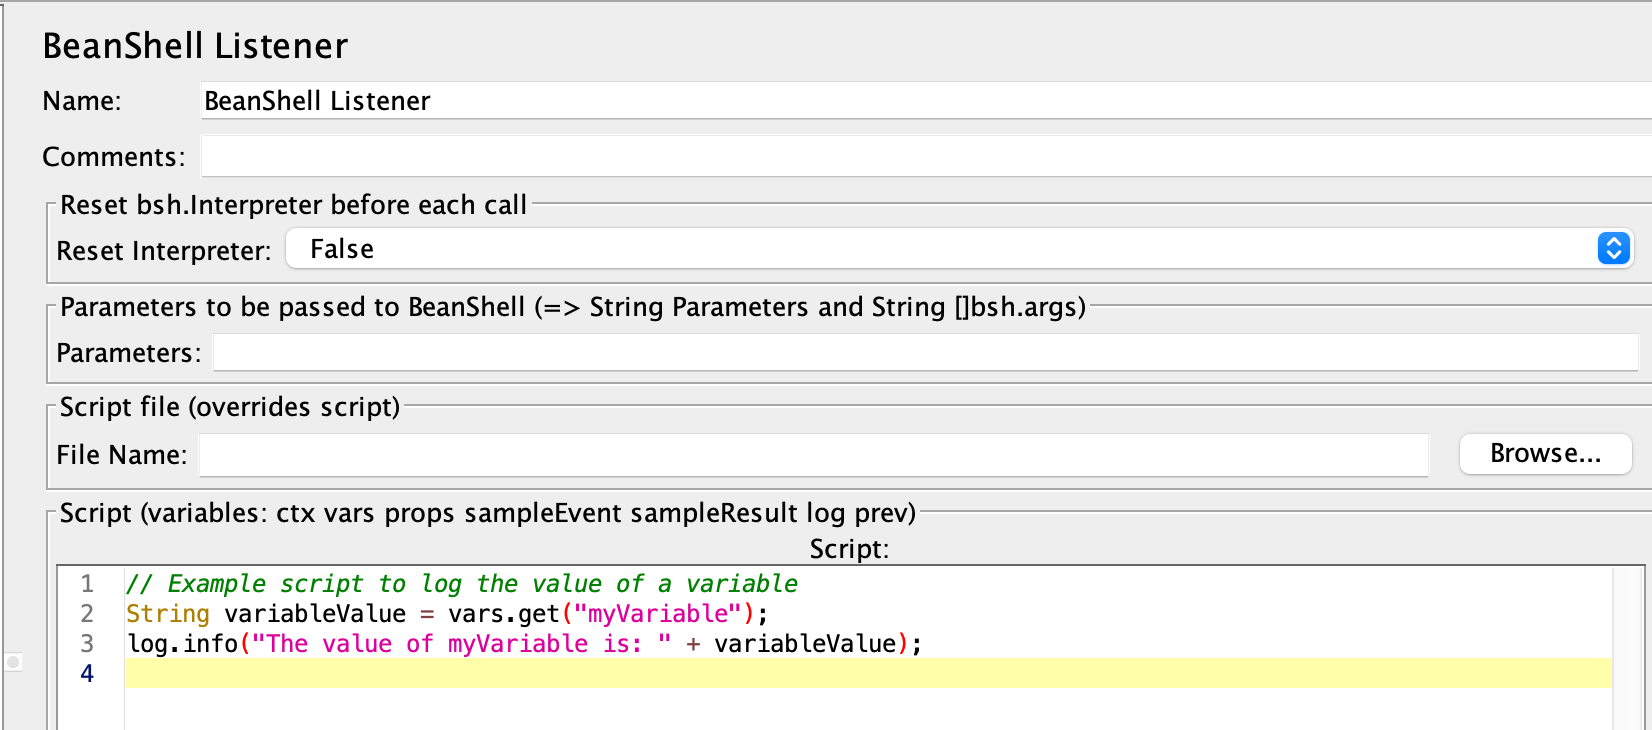
14. Bean Shell Listener
A Bean Shell Listener in JMeter allows you to execute Bean Shell scripts to perform custom actions during your test execution, such as logging variable values, processing results, or implementing complex logic. You must add it to your test plan or thread group, write your script in the provided area, and the listener executes the script at runtime, enabling you to dynamically interact with test data and results. While useful for debugging and custom validations, it's worth noting that Bean Shell may be less performant compared to alternatives like JSR223 with Groovy.
Conclusion
Listeners in JMeter serve as an essential component that shapes the raw test data into meaningful information, through a comprehensive range of visualization and analysis. Provide results in many formats – include tables and charts that may assist you to understand how your system handles under load. Access to this allows for easy debug ability as you can isolate requests and responses. In addition, results from Listeners can be exported in CSV or HTML formats to enable detailed reporting for performance benchmarks and share findings with other stakeholders. Listeners help you better understand trends in performance to pinpoint bottlenecks and then make recommendations for system optimization or capacity planning.
Thank you for reading this article. See you in the next one.