
EFK is an abbreviated form of Elasticsearch, Fluentd, and Kibana. It's a log-collecting, indexing and visualization tool. Widely used in the community with a plethora of support, it is the perfect solution for your logging needs.
In this blog, we'll learn to set up the latest version of EFK with the necessary security measures enabled. After setup, we'll create log views for our example Docker container.
Prerequisites
- Linux server with Docker pre-installed
- 6 GB RAM (at least)
Let's get started!
Setup EFK Stack
Let's start off by setting up the Docker compose files for it.
Create the parent directory using mkdir efk. Save the contents of the codeblock below into a file with the name compose.yml.
version: "3.9"

services:
  fluentd:
    build: ./fluentd
    links:
      - elasticsearch
    depends_on:
      - elasticsearch
    ports:
      - 24224:24224
      - 24224:24224/udp
    networks:
      - efk-net
    volumes:
      - $PWD/fluentd/fluent.conf:/fluentd/etc/fluent.conf
  elasticsearch:
    image: elasticsearch:8.8.0
    expose:
      - 9200:9200
      - 9300:9300
    environment:
      - discovery.type=single-node
    volumes:
      - $PWD/es/elasticsearch.yml:/usr/share/elasticsearch/config/elasticsearch.yml
      - esdata:/usr/share/elasticsearch/data
    networks:
      - efk-net
  kibana:
    image: kibana:8.8.0
    links:
      - elasticsearch
    depends_on:
      - elasticsearch
    ports:
      - 5601:5601
    environment:
      - TZ=Asia/Kathmandu
      # - ELASTICSEARCH_HOSTS=https://elasticsearch:9200
    volumes:
      - $PWD/kibana/kibana.yml:/usr/share/kibana/config/kibana.yml
    networks:
      - efk-net


volumes:
  esdata:
    name: esdata

networks:
  efk-net:
name: efk-netEFK StackNow create three separate directories. We will store config files for the different components that comprise the EFK stack in them.
mkdir -p {es,fluentd,kibana}Create Elasticsearch config
In the es directory, create a file called elasticsearch.yml and save the following contents into it.
cluster.name: "docker-cluster"
network.host: 0.0.0.0
# Enable security features
xpack.security.enabled: true

xpack.security.enrollment.enabled: false

# Enable encryption for HTTP API client connections, such as Kibana, Logstash, and Agents
xpack.security.http.ssl:
  enabled: false
# Enable encryption and mutual authentication between cluster nodes
xpack.security.transport.ssl:
enabled: falseelasticsearch.ymlCreate Kibana configuration
In the Kibana directory, create a file kibana.yml,
server.host: "0.0.0.0"
server.shutdownTimeout: "5s"
elasticsearch.hosts: [ "http://elasticsearch:9200" ]
monitoring.ui.container.elasticsearch.enabled: true
elasticsearch.ssl.verificationMode: "none"kibana.ymlCreate the Fluentd Docker container
Create the following files Dockerfile, entrypoint.sh, fluentd.conf and copy the contents into the files respectively.
# image based on fluentd v1.14-1
FROM fluentd:v1.14-1

# Use root account to use apk
USER root

# below RUN includes plugin as examples elasticsearch is not required# you may customize including plugins as you wish
RUN apk add --no-cache --update --virtual .build-deps \
        sudo build-base ruby-dev \
&& gem uninstall -I elasticsearch \
&& gem install elasticsearch -v 7.17.0 \
&& sudo gem install fluent-plugin-elasticsearch \
&& sudo gem sources --clear-all \
&& apk del .build-deps \
&& rm -rf /tmp/* /var/tmp/* /usr/lib/ruby/gems/*/cache/*.gem

# copy fluentd configuration from host image
COPY ./conf/fluent.conf /fluentd/etc/
# copy binary start file
COPY entrypoint.sh /bin/

RUN chmod +x /bin/entrypoint.sh

USER fluentDockerfile#!/bin/sh
#source vars if file exists
DEFAULT=/etc/default/fluentd
if [ -r $DEFAULT ]; then
set -o allexport
. $DEFAULT
set +o allexport
fi
# If the user has supplied only arguments append them to `fluentd` command
if [ "${1#-}" != "$1" ]; then
set -- fluentd "$@"
fi
# If user does not supply config file or plugins, use the default
if [ "$1" = "fluentd" ]; then
if ! echo $@ | grep -e ' \-c' -e ' \-\-config' ; then
set -- "$@" --config /fluentd/etc/${FLUENTD_CONF}
fi
if ! echo $@ | grep -e ' \-p' -e ' \-\-plugin' ; then
set -- "$@" --plugin /fluentd/plugins
fi
fi
exec "$@"entrypoint.sh# bind fluentd on IP 0.0.0.0
# port 24224
<source>
@type forward
port 24224
bind 0.0.0.0
</source>
# sendlog to the elasticsearch
# the host must match to the elasticsearch
# container service
<match *.**>
@type copy
<store>
@type elasticsearch
host elasticsearch
port 9200
logstash_format true
logstash_prefix fluentd
logstash_dateformat %Y%m%d
include_tag_key true
type_name access_log
tag_key @log_name
flush_interval 300s
</store>
<store>
@type stdout
</store>
</match>fluentd.confStarting the Stack
Once all the config files and container images are ready, we can start the stack with the command,
docker compose up -dNow that the stack is up, the Fluentd and Kibana containers will display some errors related to authentication with the elasticsearch container. That's because our elasticsearch container is configured to allow clients access only when they perform a username & password-based authentication. To fix these errors, we'll do the following:
1. SSH into elastic container
Get the container ID of elasticsearch using,
docker psand then SSH into it,
docker exec -it <elastic_container_id>2. Generate passwords
bash bin/elasticsearch-setup-passwords autoThis command is provided by default in Elasticsearch version 8 and can be used to generate authentication credentials. Running the command provides a set of credentials for different clients. Copy and store the credentials in a safe place.
3. Add credentials in the Fluentd and Kibana config files
In the fluentd.yml and kibana.yml files add username & password in the following way:
a) For fluentd.yml
<match *.**>
  @type copy
  <store>
	...
    ...
    user elastic
    password <enter_the_generated_password_for_fluentd_user>

  </store>
  <store>
    @type stdout
  </store>
</match>fluentd.ymlb) For kibana.yml
...
...
elasticsearch.hosts: [ "http://elasticsearch:9200" ]
...
...
elasticsearch.username: "kibana"
elasticsearch.password: "<enter_the_generated_password_for_kibana_user>"kibana.ymlNow that our passwords are configured, let's restart the stack.
The previous configuration will be restored upon restart. However, if you delete the Docker volume, the configuration will be deleted along with the volume.
Finally, we should be able to log in to the Elastic dashboard using the generated credentials. Also, Fluentd and Kibana should be working now.
Logging
Now let's check if logs are being forwarded to Fluentd. Let's run an example container and push logs to it. For this, we will use the Docker driver to push logs.
Step 1: Run a container with logging enabled
Run a Docker container with Fluentd logging driver enabled using the command below:
docker run -p 80:80 -itd --name nginx_container4 --log-driver=fluentd --log-opt fluentd-address=fluentd-host:24224 nginx:alpineStep 2: Generate some noise
Use the curl command to send some requests to the container and generate noise in the logs.
curl localhost:80Step 3: View the Logs
Now open the Kibana dashboard at http://localhost:5601 to set up a log view.
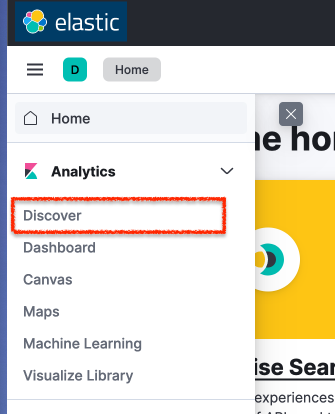
Click the hamburger menu on the left, and in the Analytics section, select the Discover subsection.
Here, we'll now create a log view.
Click on the leftmost button highlighted in blue in the dashboard and select the Create a data view button.
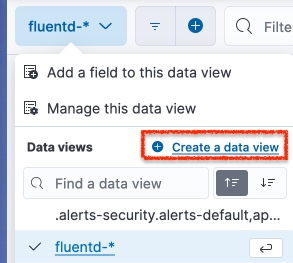
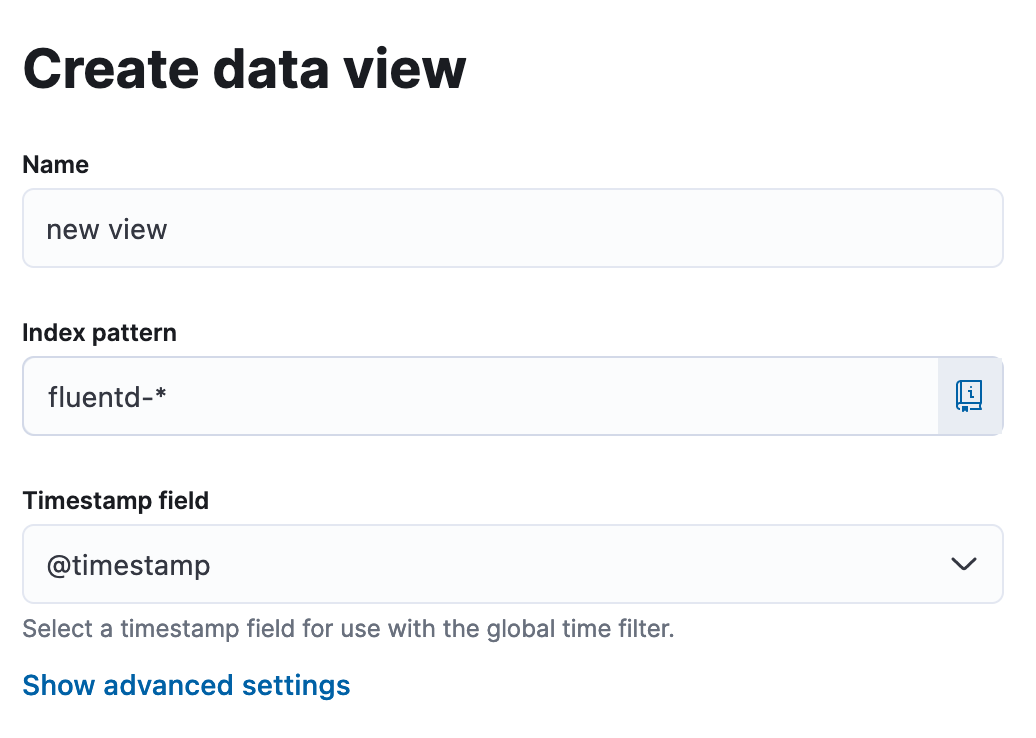
Create a data view in cases where EFK is newly set up.Give a name to the data view, and in the pattern section, write the following text fluentd-*. Other fields can be left as is.
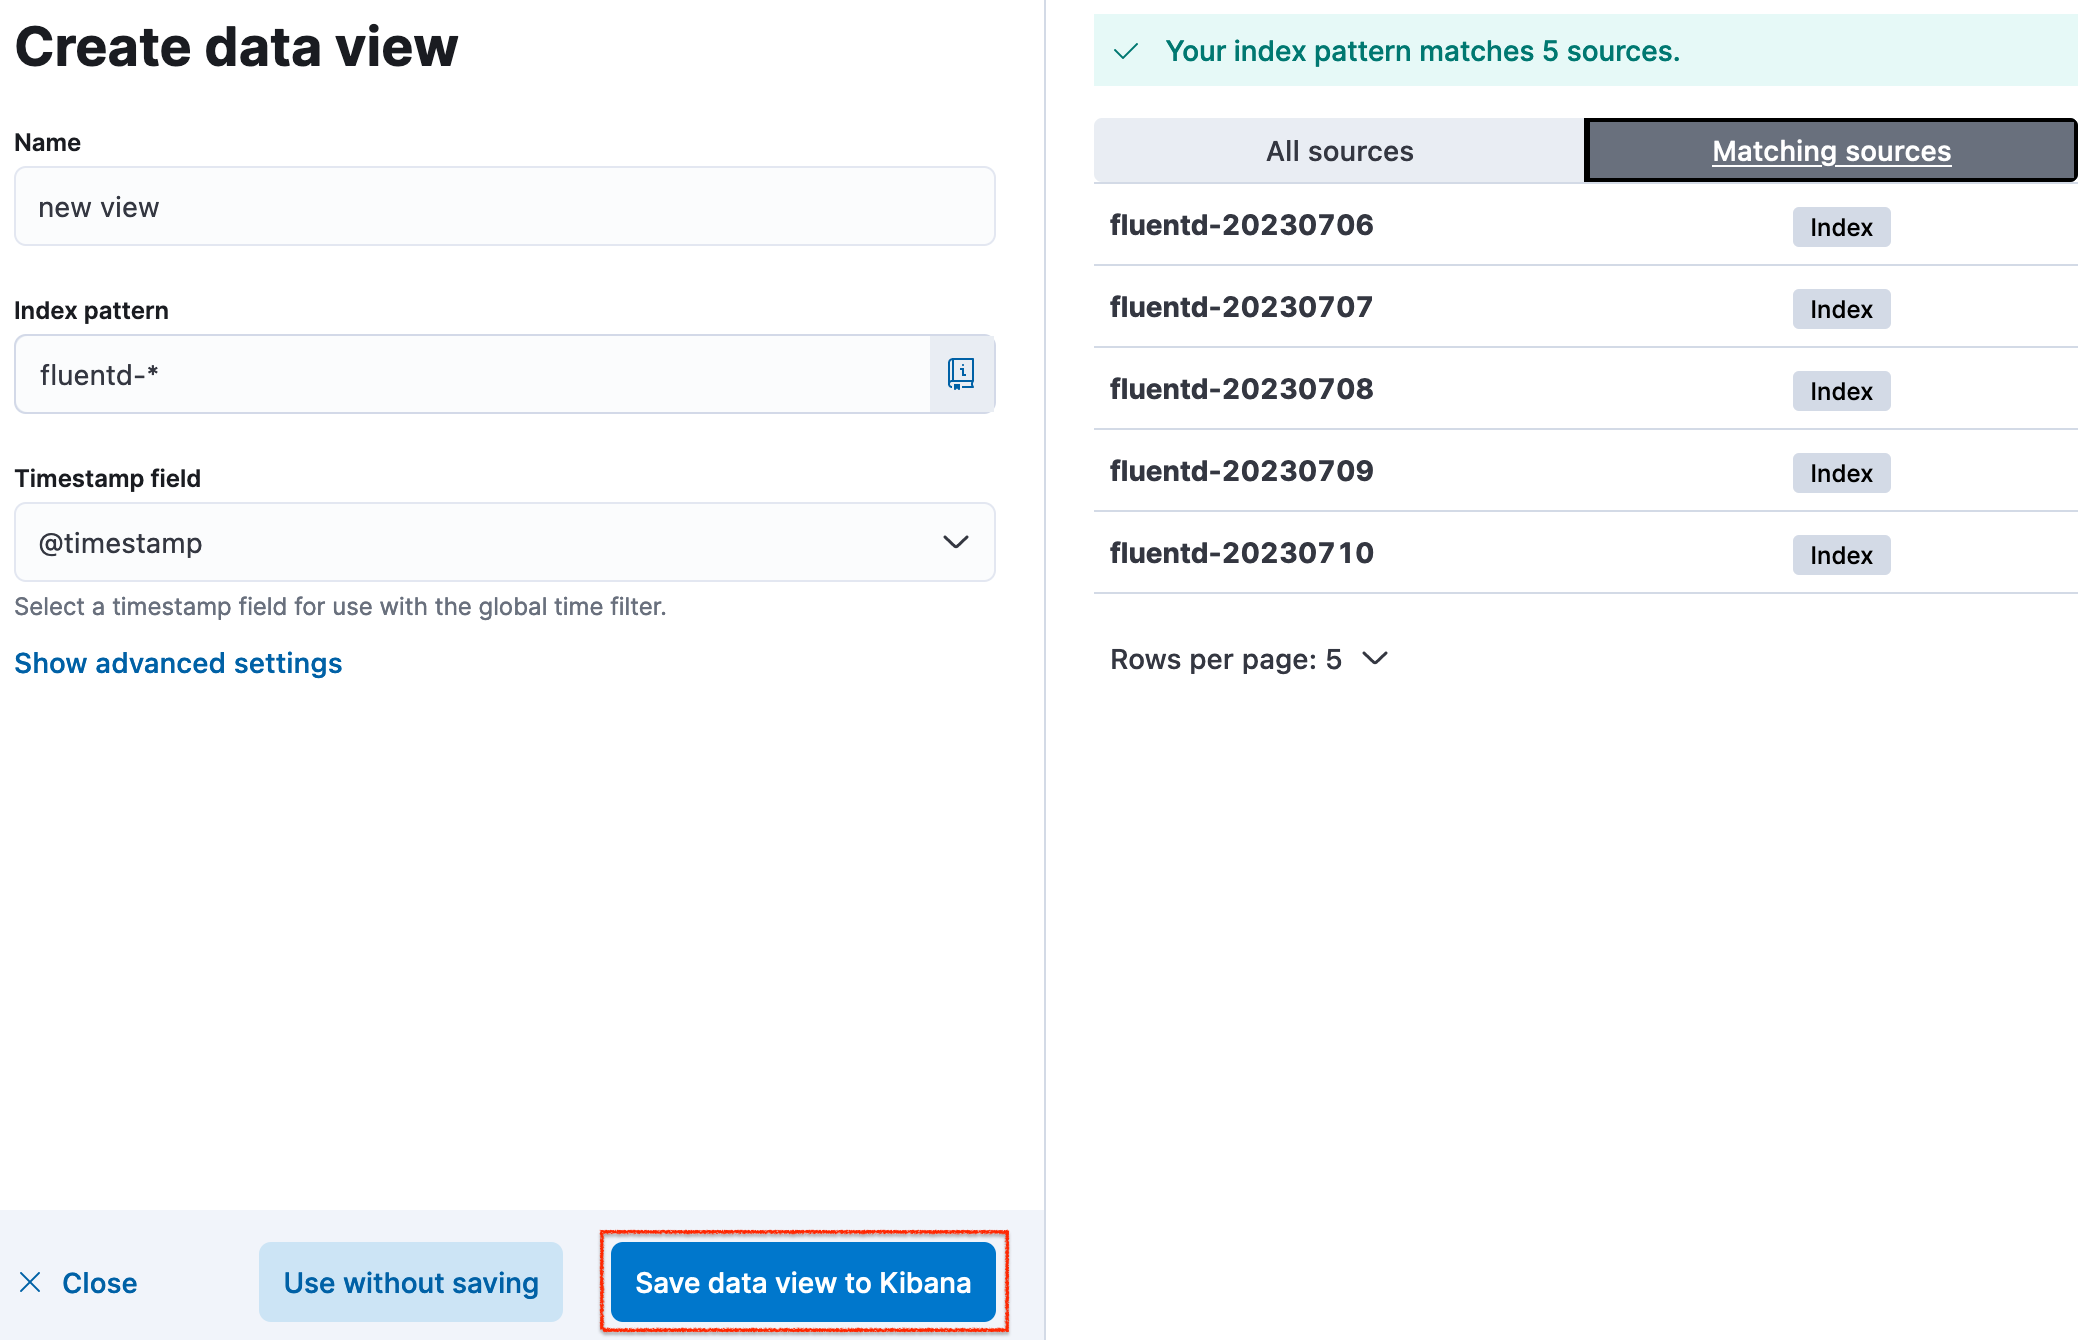
Now save the data view to Kibana. In my case, I had existing indices which is why many are on the list. But in your case, there will only be one with the current date i.e. fluentd-YYYY-MM-DD.
After saving the data view, we will be greeted with a view like this:
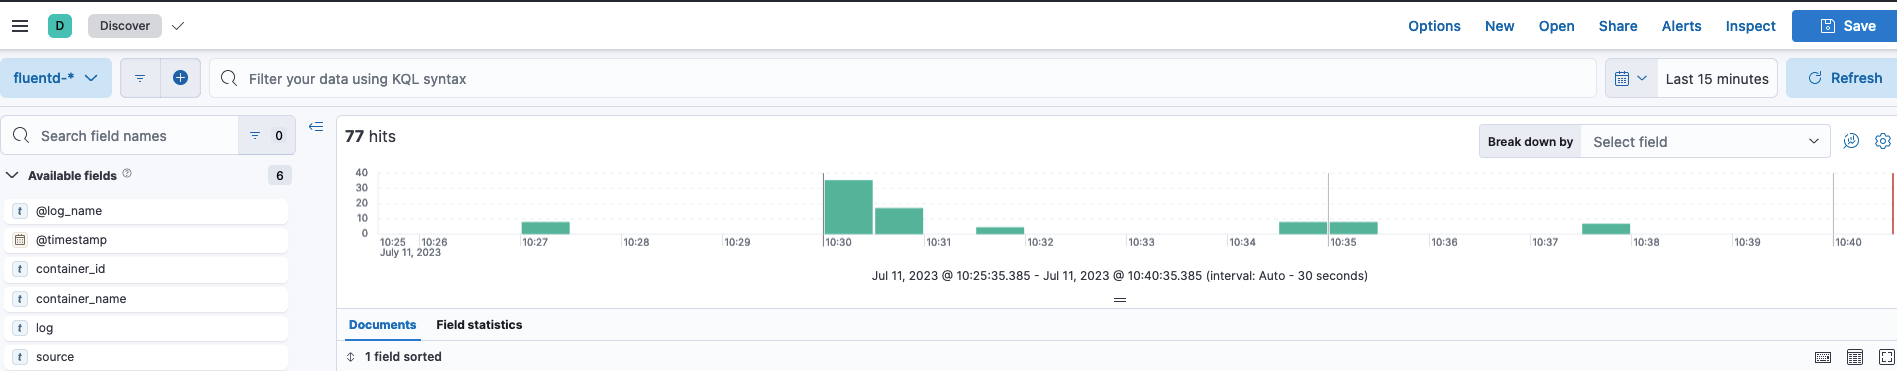
If you click on the filter tab, many options will be available. We will use the container_name filter to filter out the container that we recently used and view its logs.
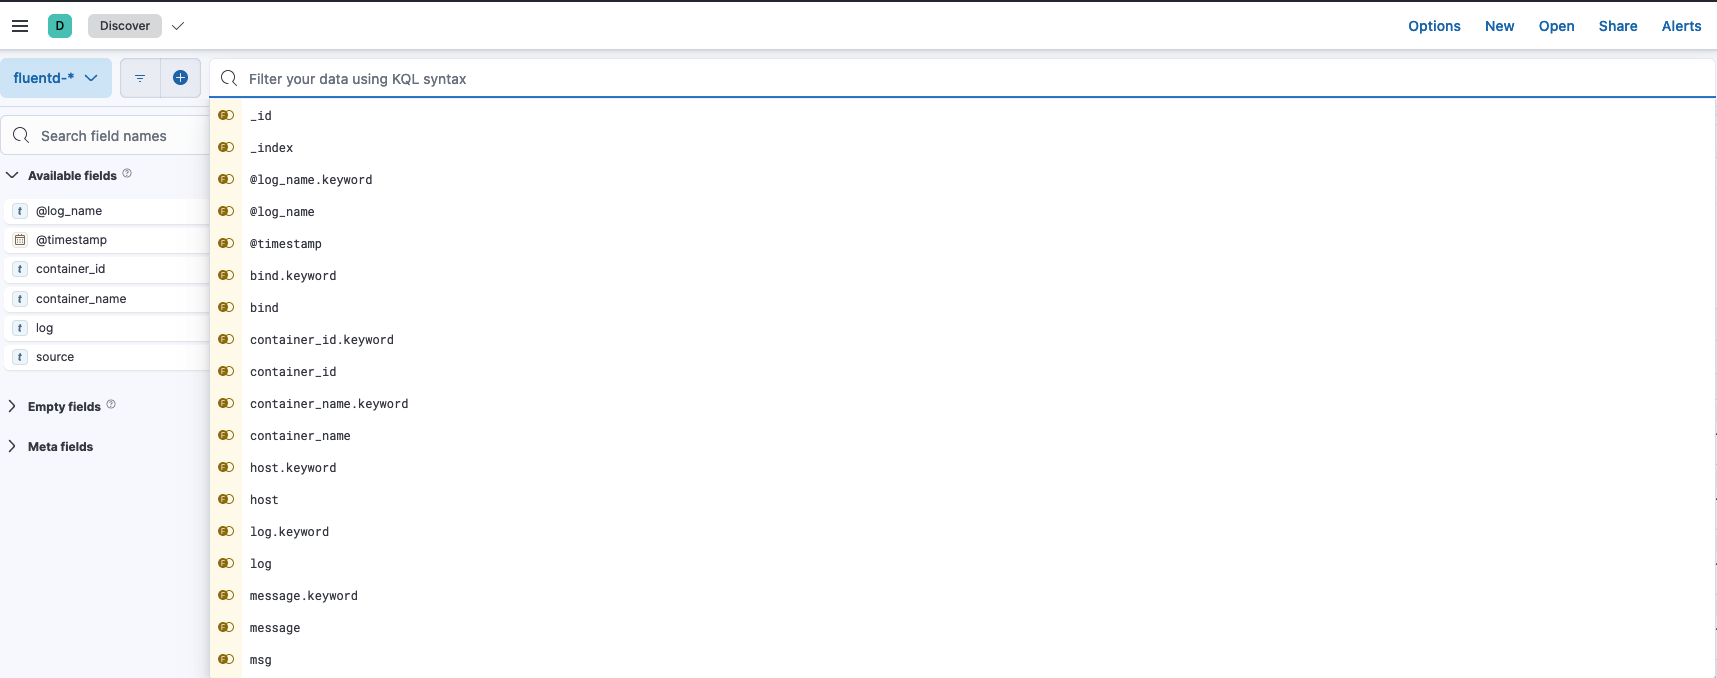
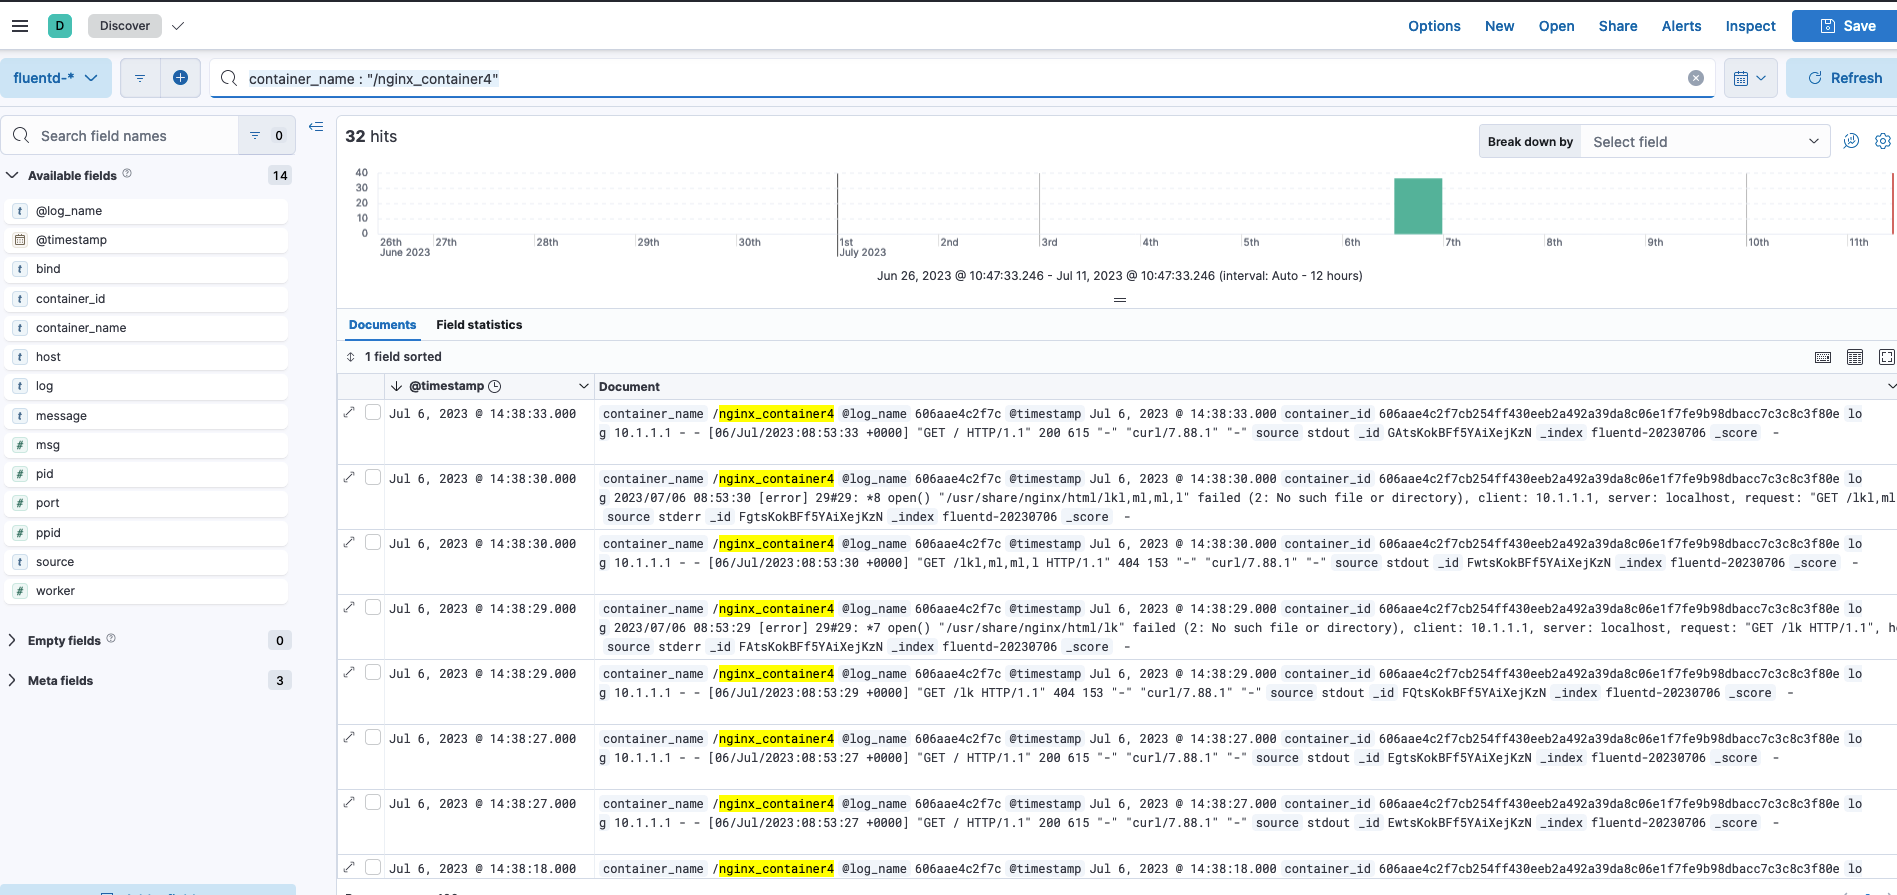
Use this to filter out logs from the Nginx container only,
container_name : "/nginx_container4"Now, we should see the logs generated by the Nginx Docker container in the Kibana dashboard.
This is just a simple use case of the EFK stack; it can be utilized further to build more informative and complex dashboards.
Conclusion
In this blog, we learned to set up an EFK cluster, log Docker container requests using the Fluentd Docker logging driver and finally visualized the logs in our Kibana dashboard.
Subscribe and leave a comment below if you have any queries. I try to periodically update my articles to ensure legibility.