
Effective data visualization is crucial in conveying complex information concisely and visually appealingly in today's data-driven world. Bar graphs are popular for representing categorical data and comparing values across different categories.
In this blog post, we will explore how to create stunning bar graph visualizations in After Effects using CSV data, enabling you to present your data dynamically and engagingly.
Prerequisites
To follow along with this tutorial, you will need:
- After Effects (version CS6 or later)
- Basic knowledge of After Effects interface and keyframes
- CSV data file with categorical data and corresponding values
Understanding CSV Data
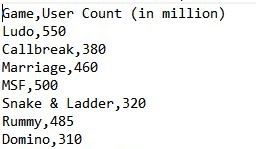
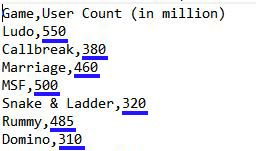
Comma-separated values (CSV) is a simple and widely used file format for storing tabular data. Each row in the CSV file represents a category, and the columns contain the relevant data for each category.
Before diving into the visualization process, ensure your CSV data is properly structured. Include appropriate headers for the columns and ensure the data is accurately represented.
Turning CSV Data to Bar Graph
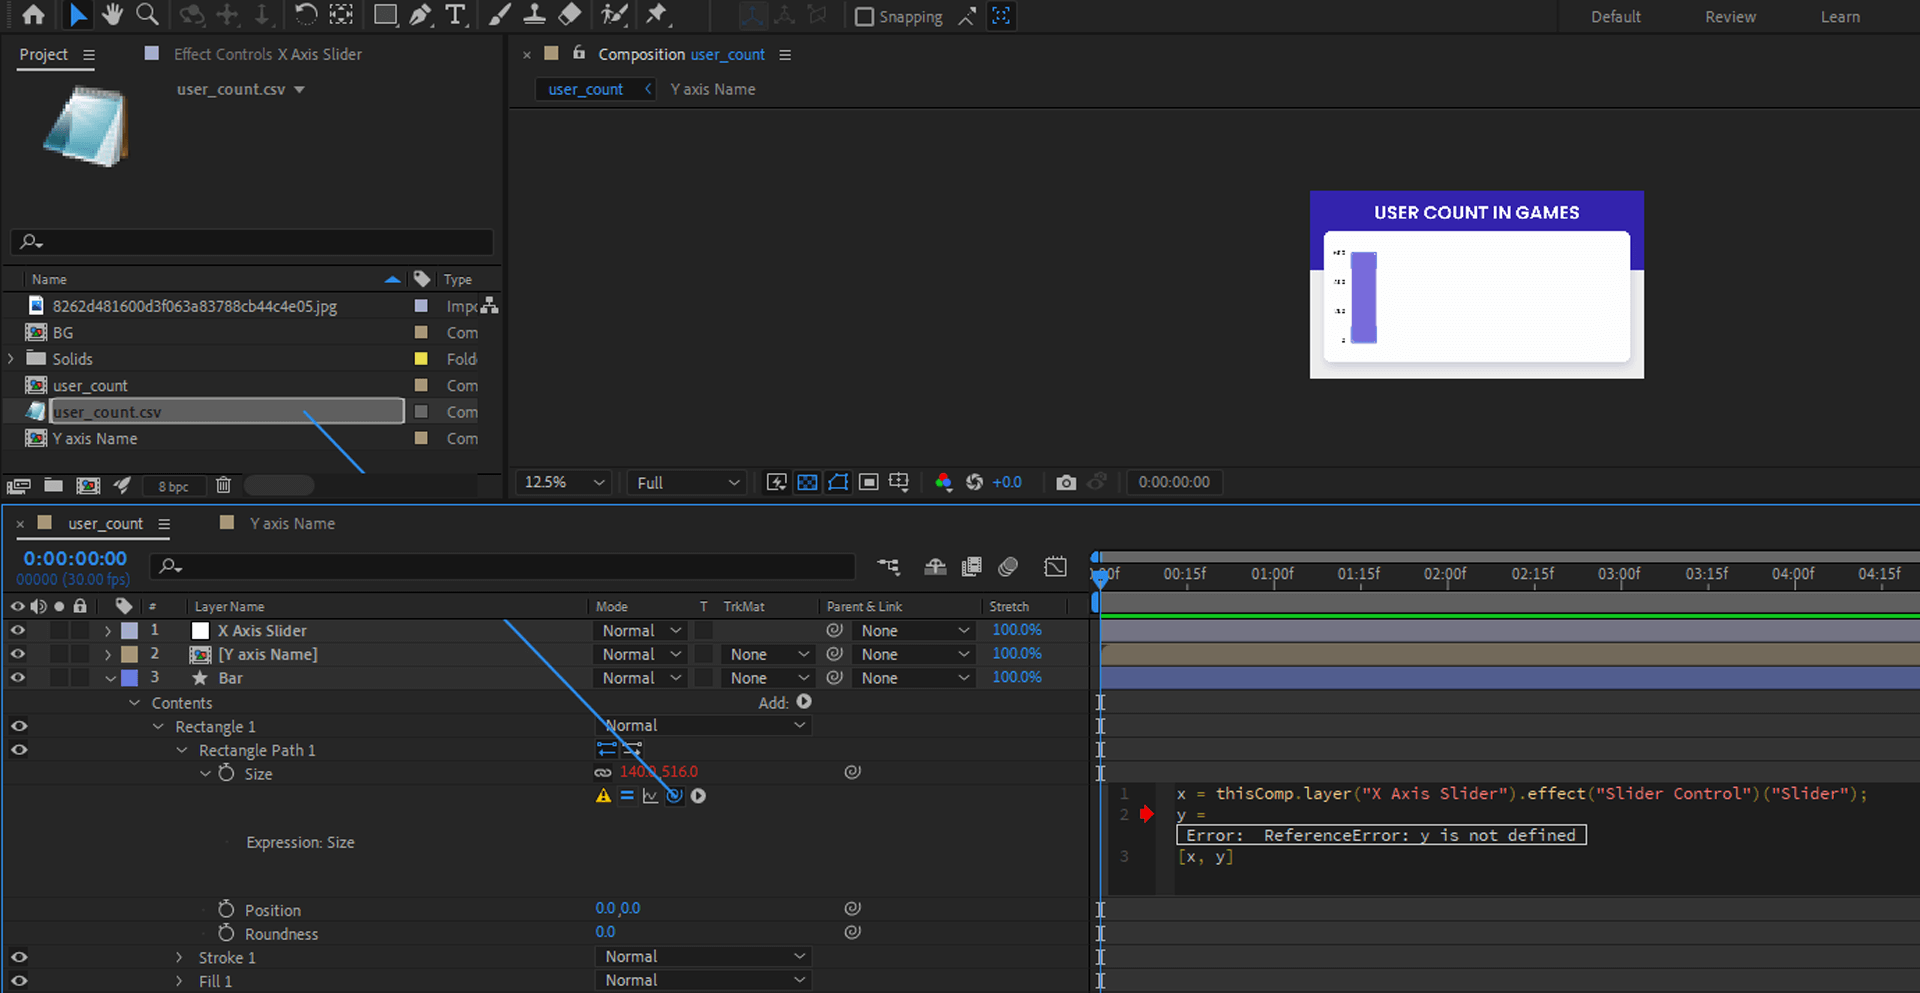
Step 1: Import the CSV Data into After Effects
First, go to After Effects and create a new composition. Then go toFile > Import > File, and select your CSV file. In the import settings, choose Footage for Import Kind and select CSV as the file type. After Effects will import the CSV data as a footage item.
Step 2: Create a Bar Graph
To create a bar graph in After Effects, we can use the shape tool, i.e. rectangle shape with its anchor at the bottom end of the bar. We can do it both statically or dynamically.
In a static process, we can apply changes to scale property manually. In a more dynamic process, we can link the shape sizes to CSV data values and keep visualization updated with data changes.
Step 3: Link CSV Data with Bar Shapes
Add adjustment layer named X Axis Slider which has two sliders – Bar Weight and Gap Slider for bar size and gaps between them.
To link the data with shapes, make a bar with the help of shape tools such as rectangles.
Use the shape path property to write the bar height expression to raise the values stored in the CSV file.
Press ALT and click Watch to enable the expression sheet.
Here, X is linked to the Bar Weight Slider of the Adjustment Layer, and Y is linked to the value or data inside the CSV File. user_count.csv is the CSV file used currently.
We set the dataValue of the CSV file as ([index value of CSV category, index value of CSV data]).
CSV category determines the column we choose, which is User Count in this case, so the index of the category is set to 1 and the index of value depends on the index of the layer in After Effects.
Say layer with 1 index in After Effects will show the user count of Ludo.
x = thisComp.layer("X Axis Slider").effect("Bar Weight")("Slider");
y = footage("user_count.csv").dataValue([1,index-1]);
[x, y];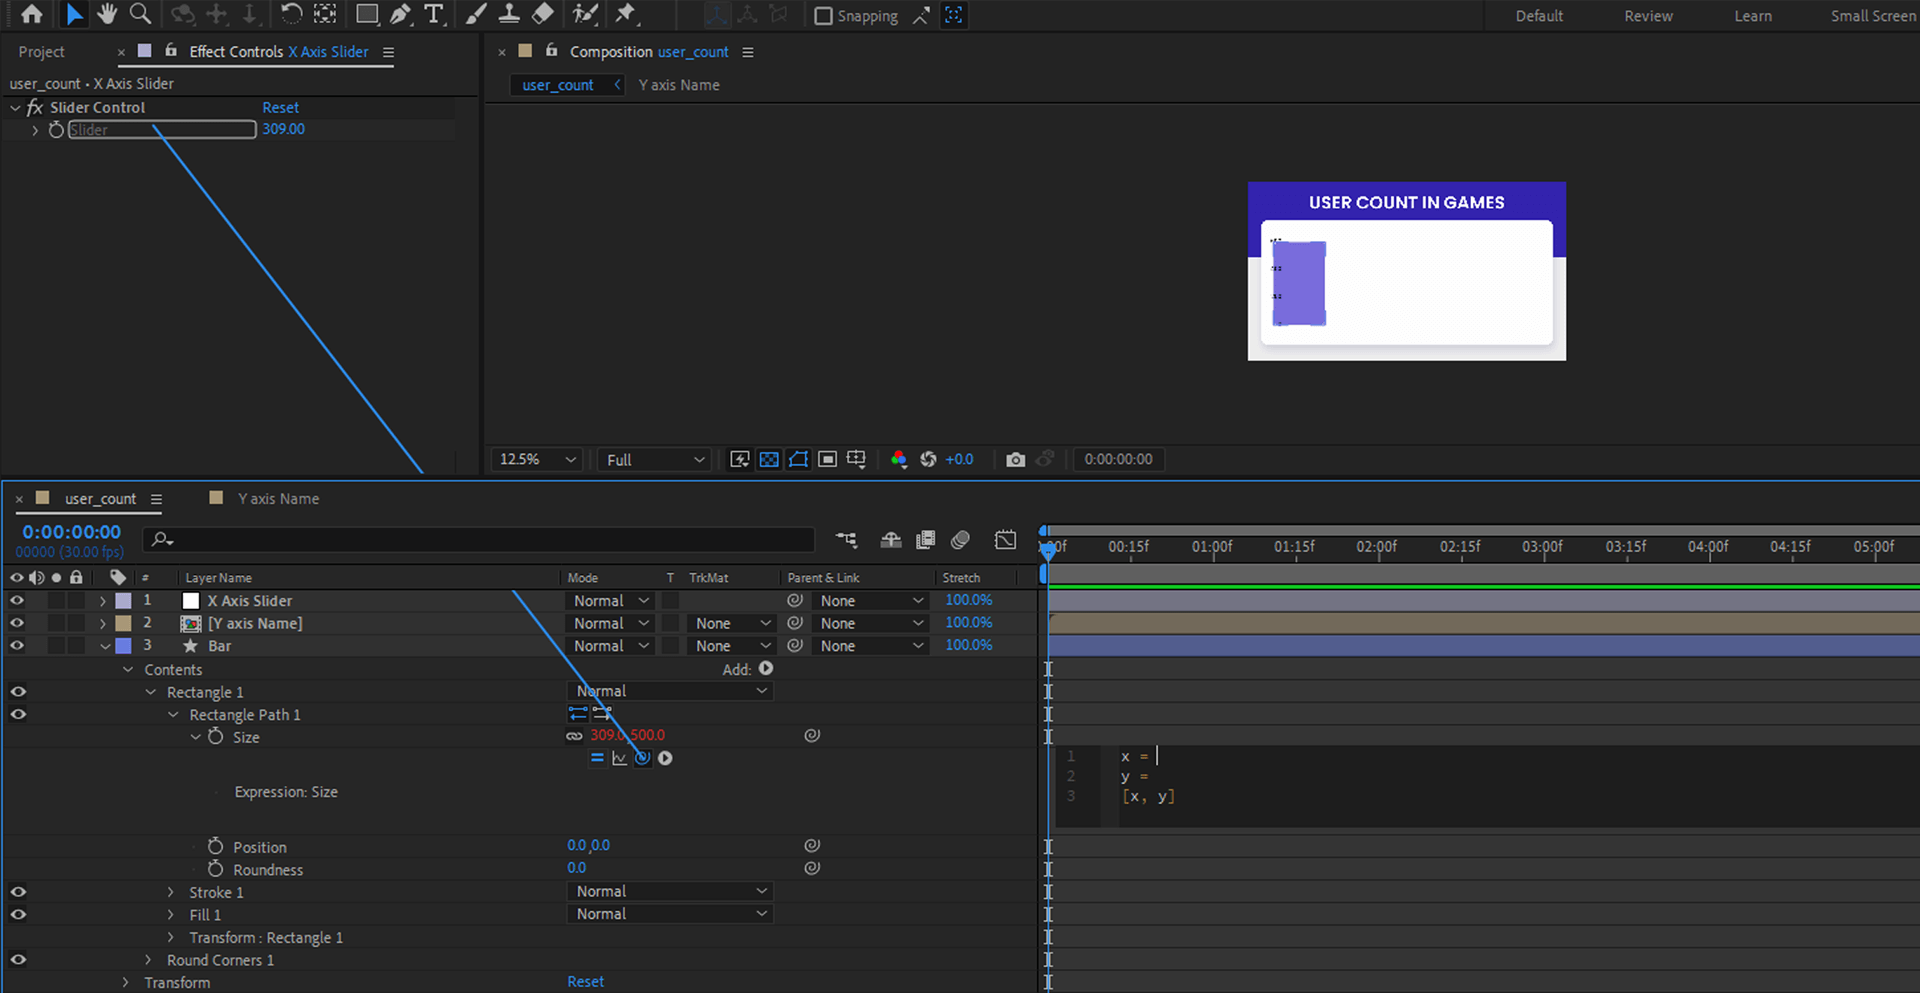
Step 4: Customize the Bar Graphs
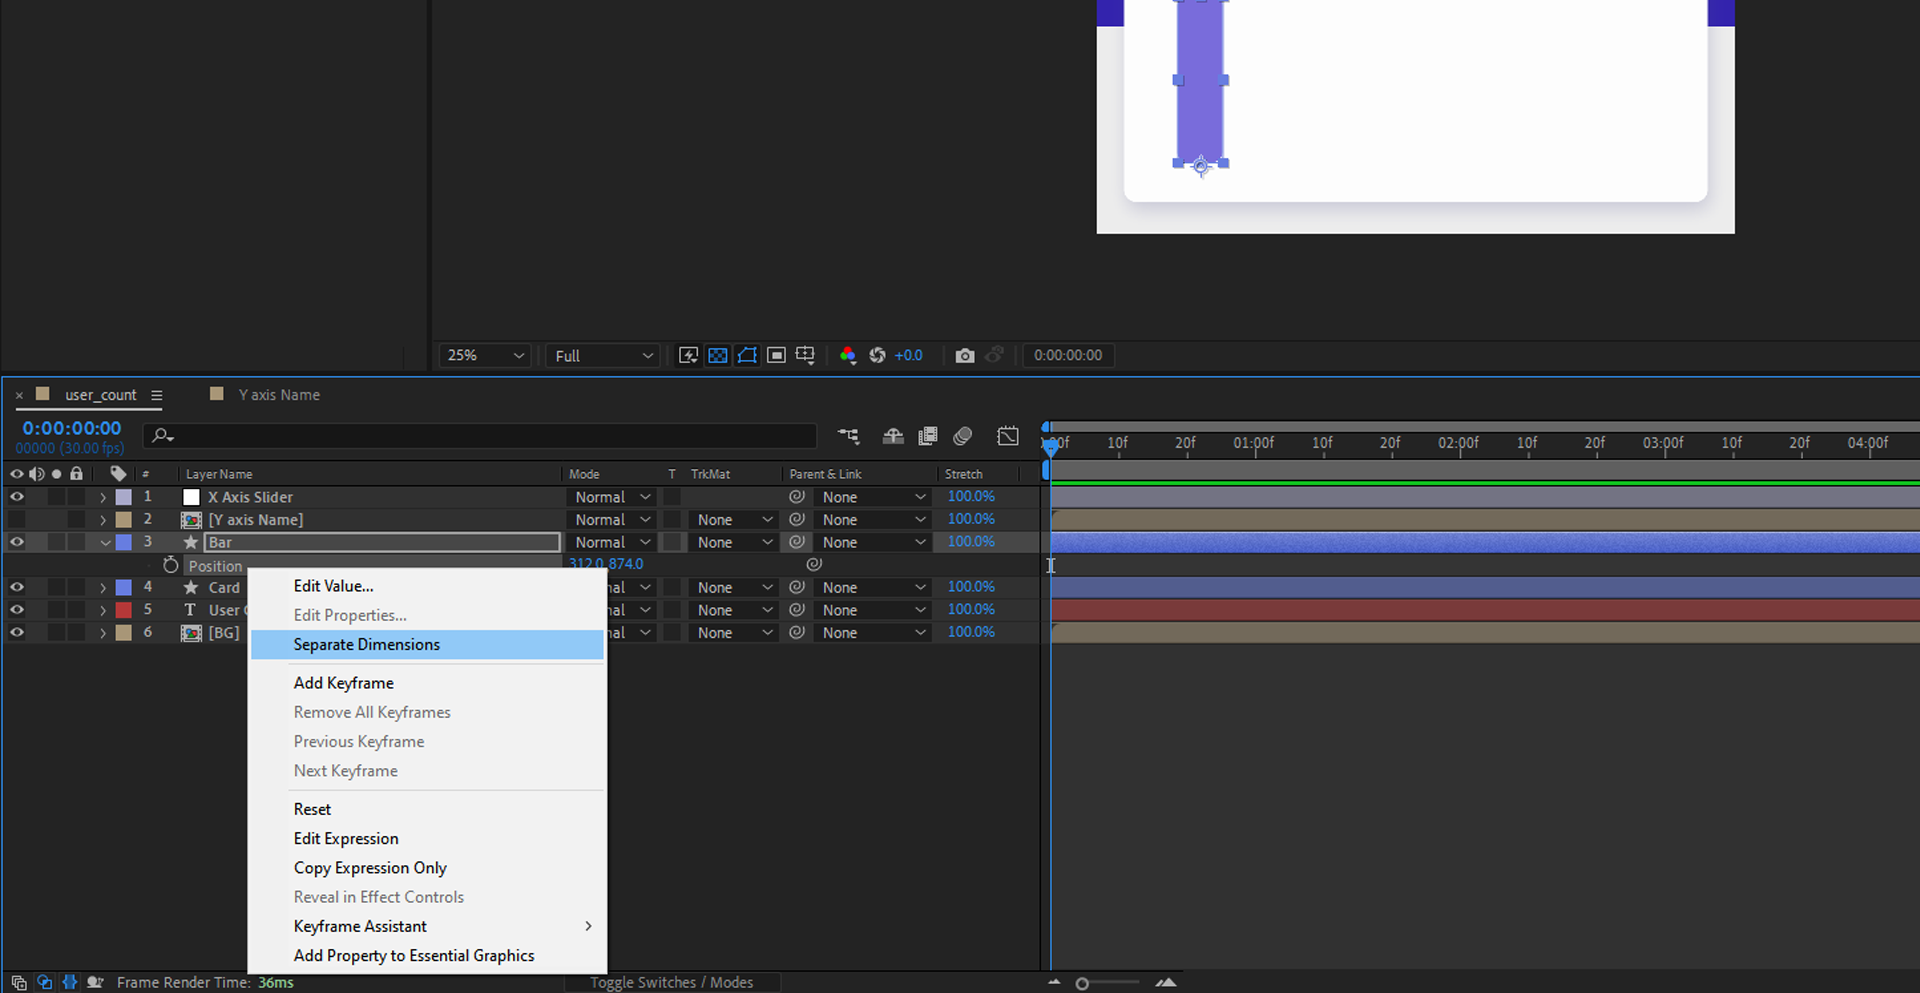
First, separate the dimensions of position in the shape layer since the X-axis will be used to manage the gaps between the bars.
Link the X using Pickwhip to Gap Slider of the Adjustment Layer.
To create a gap between each bar layer, we must multiply them with the Index Value to create a uniform distance. The above example has a layer with index 2 selected.
The expression should look like this:
thisComp.layer("X Axis Slider").effect("Gap Slider")("Slider") * index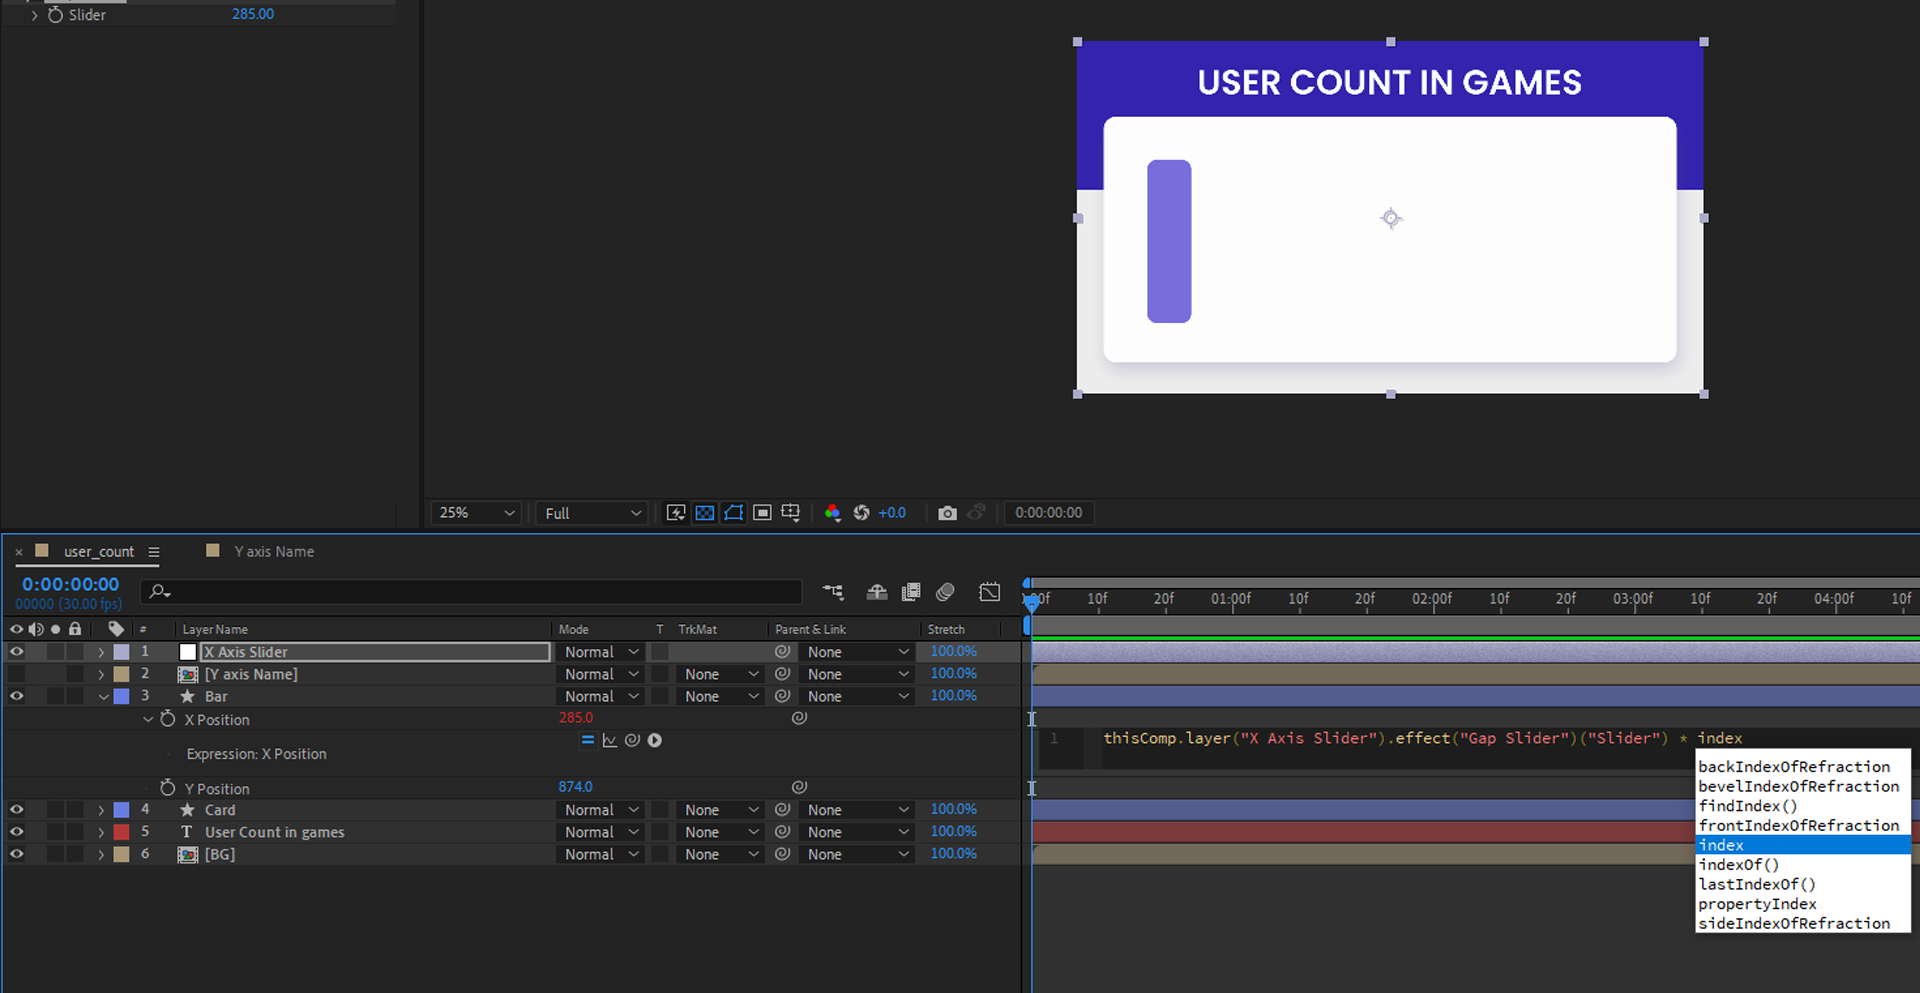
Let's break down the expression one by one.
a. thisComp.layer("X Axis Slider") – Refers to X-Axis Slider in the current composition (thisComp).
b. thisComp – Is a keyword that represents the current composition in which the expression is used.
c. layer("X Axis Slider") – Is a method that retrieves a specific layer by its name.
d. .effect("Gap Slider") – Indicates that we want to access an effect on the X-Axis Slider layer.
e. .effect() – Is a method used to retrieve an effect applied to a layer.
f. "Gap Slider" – Is the name of the effect we want to access.
g. ("Slider") – Specifies the parameter of the effect we want to retrieve.
h. "Slider" – Is the name of the parameter we want to access within the Gap Slider effect.
i. ("Slider")("Slider") – Retrieves the value of the Slider parameter within the Gap Slider effect. The first "Slider" represents the effect name, and the second "Slider" represents the parameter name.
j. * index – Multiplies the v Slider parameter by the index of the current layer.
k. index – Is a system variable that represents the index of the current layer in the composition. Multiplying the Slider parameter values by the layer index allows for dynamic variation of the property value based on the layer's position in the layer stack.
Overall, these expressions retrieve the Slider parameter value from the Gap Slider effect applied to the X-Axis Slider layer and multiply it by the current layer's index. The result of this calculation will be used as the value for the specific property where this expression is applied.
Step 5: Feed Data Value for Game Names
Create a text layer.
Go to Text Property and open Source Text.
Link it to the CSV File using Pickwhip or use the following expression directly.
footage("user_count.csv").dataValue([0,index-1])user_count.csv File’s Game Name Data Values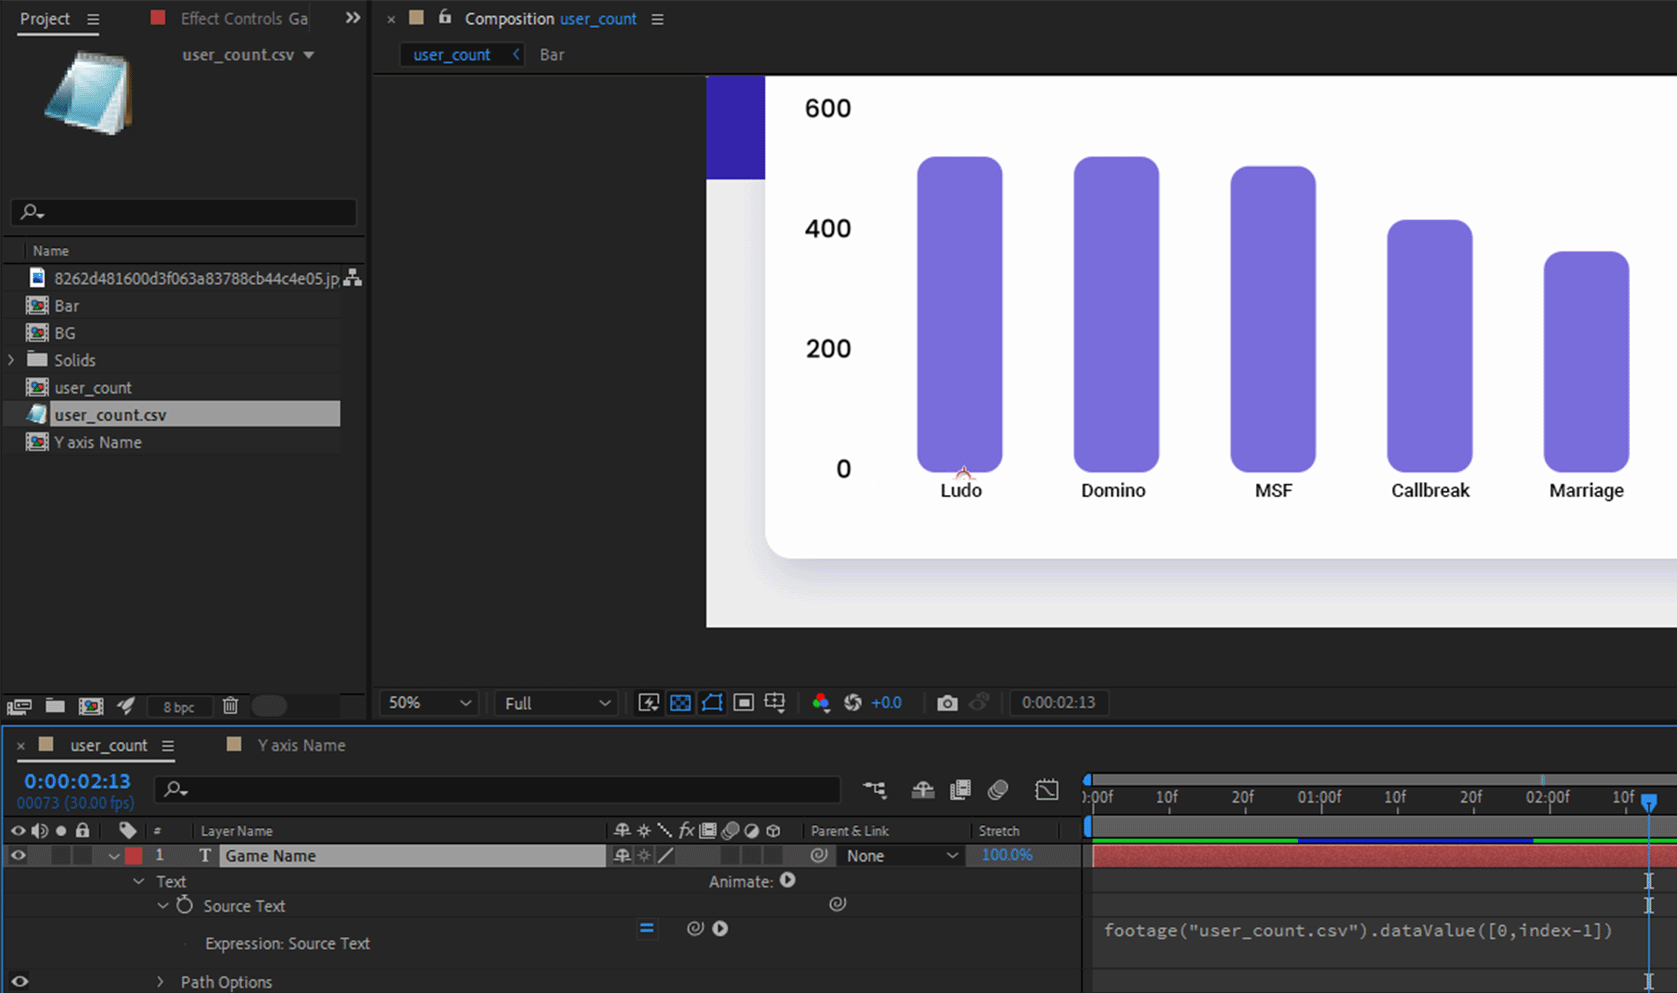
Step 6: Animate the Bar Graphs
Use Keyframes to add animation to the bar graphs.
Scale the bar shape from a single layer to control the animation from a single source point.
Uncheck the constraints proportion of scale property as we will not have uniform scaling.
Check the stopwatch at the initial point where the value will be minimum so the bars won't be seen.
Place another keyframe with a scale value 100% for the Y property at the endpoint or when the animation ends. This will show the bar according to the CSV value.
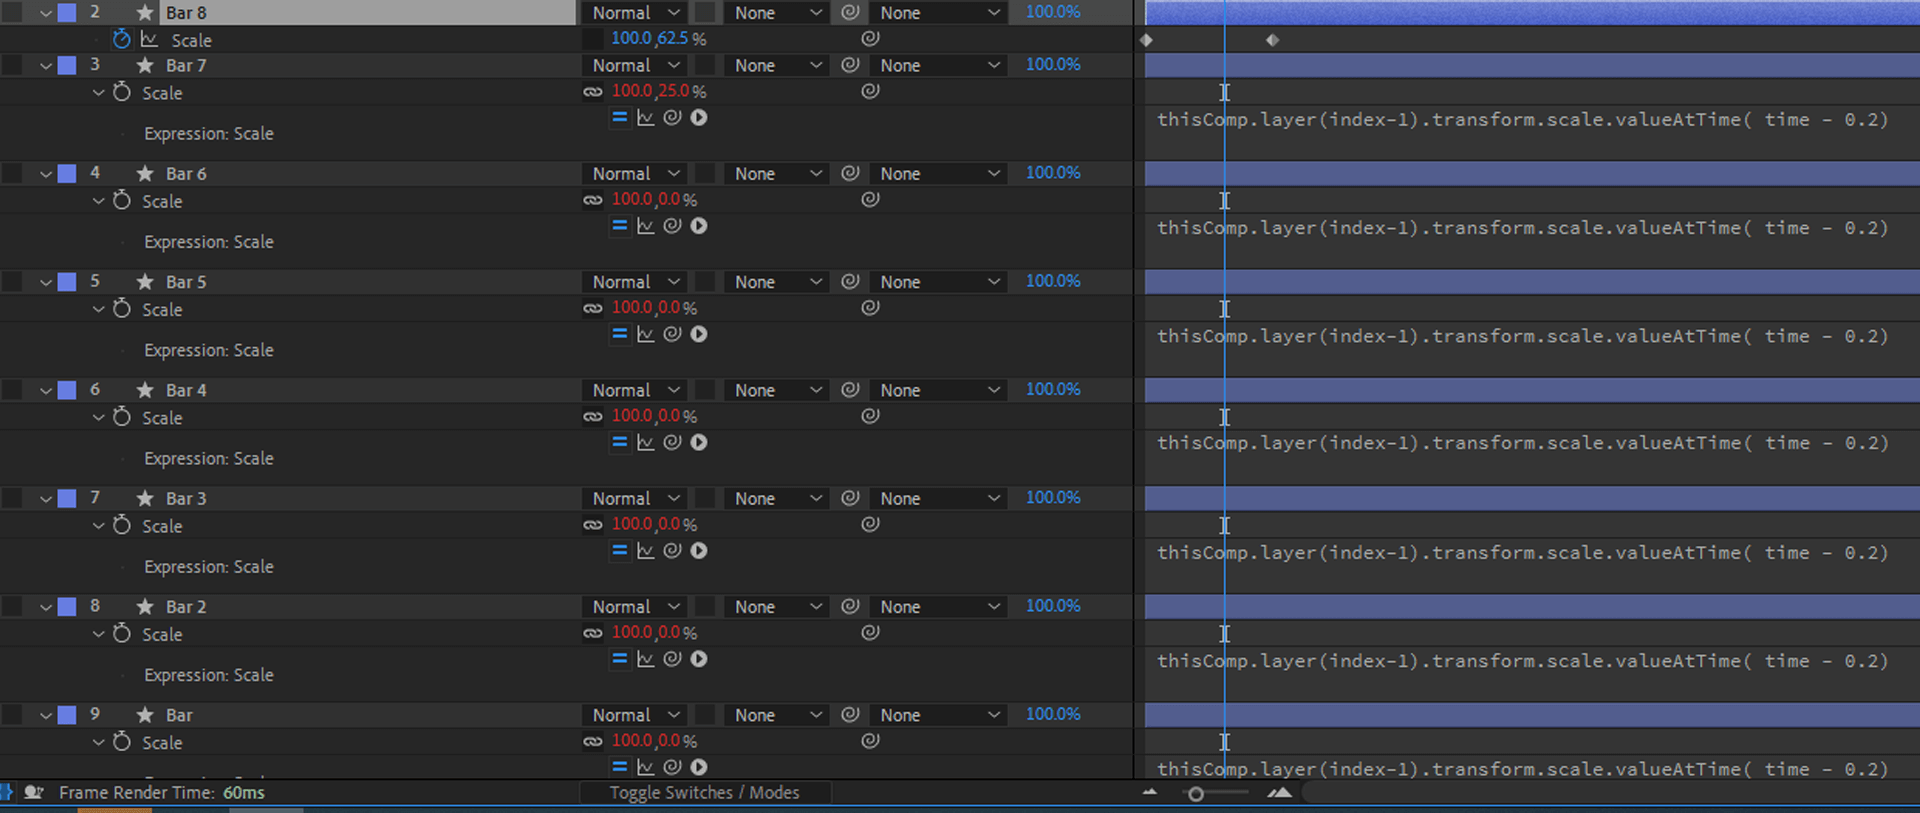
Now, to all other remaining bar layers, add the following expression:
thisComp.layer(index-1).transform.scale.valueAtTime( time - 0.2)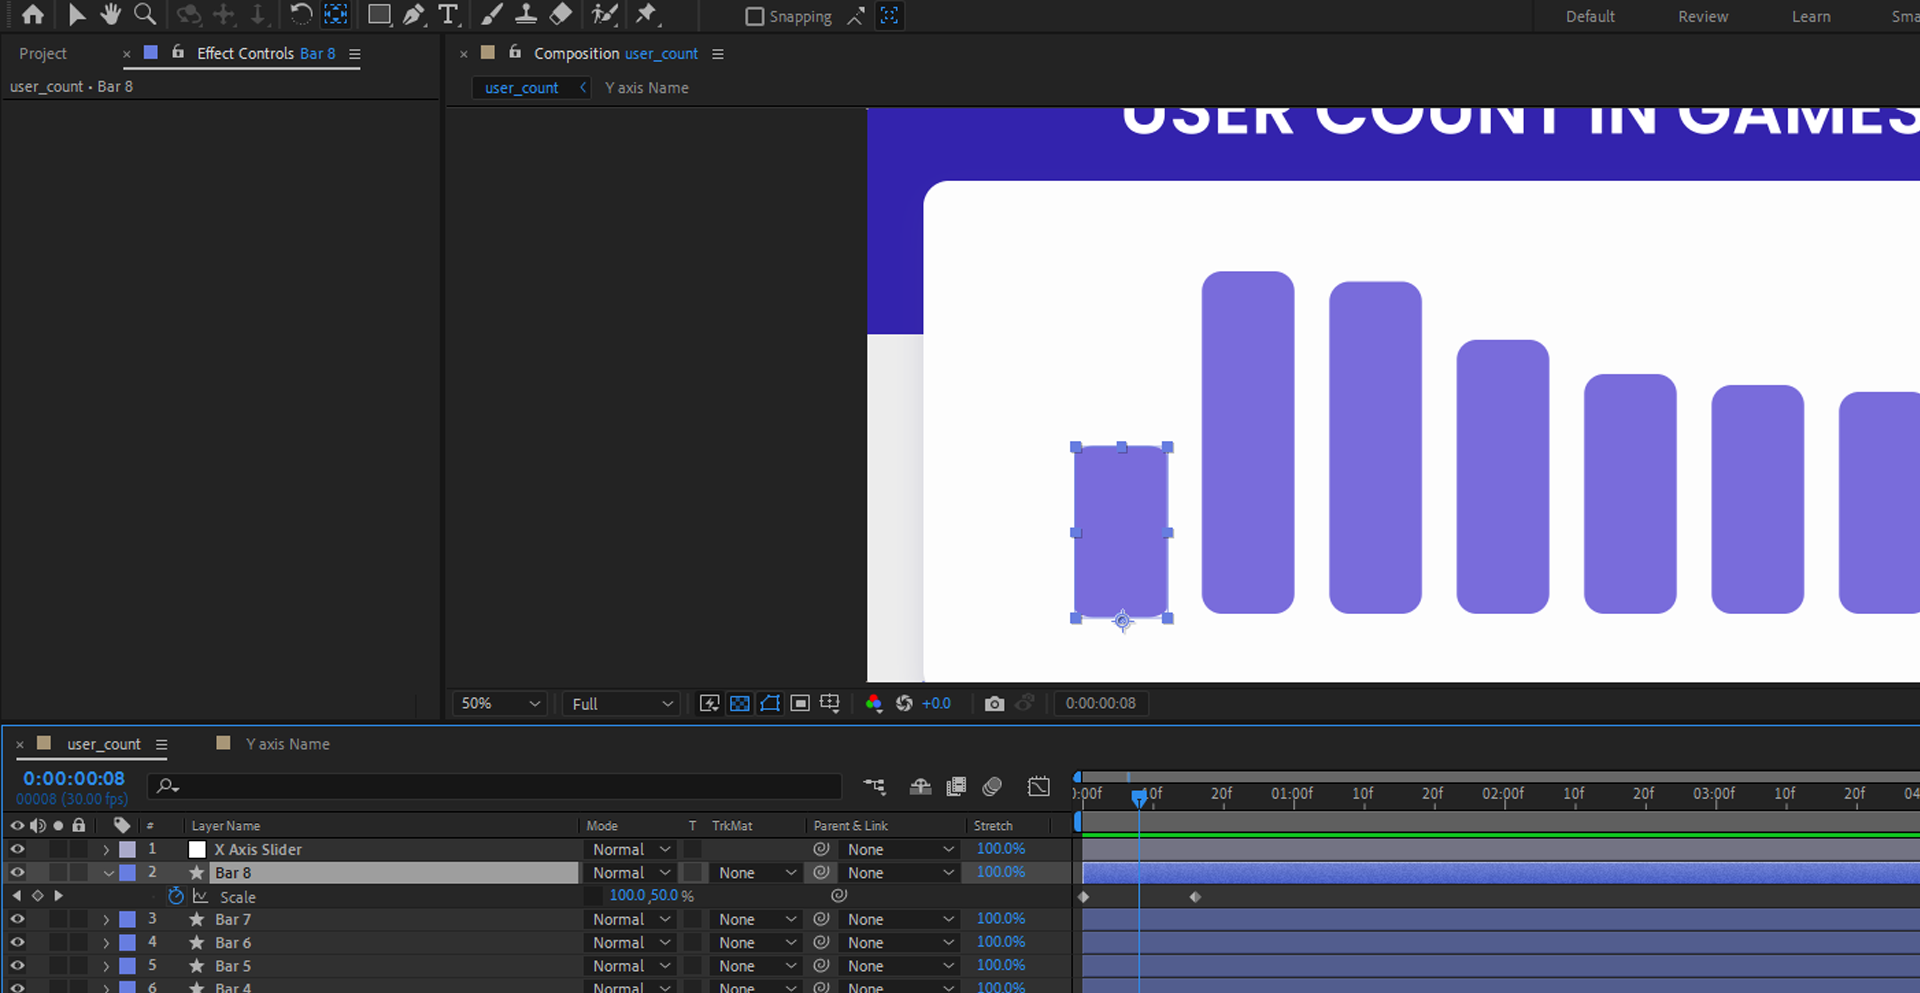
Step 7: Enhance Visuals
After Effects offers various tools and effects to enhance your bar graph visualization. Here's how we will be utilizing these tools:
- Add text labels to provide additional context to the data.
- Incorporate titles and backgrounds to create a visually appealing composition.
- Experiment with various effects like gradients, shadows, and glows to enhance the visual impact.
- Utilize other visual elements or even animate them to further engage the audience.
Step 8: Preview and Export
Preview your bar graph visualization by pressing the Spacebar or using the RAM preview feature in After Effects.
Adjust the timing and animation as needed.
When ready to share your visualization, go to Composition > Add to Render Queue.
Choose your desired output format and configure the settings.
Click Render to export the final visualization.
Data visualization with bar graphs is a powerful way to communicate information effectively. After Effects provides a versatile platform to transform CSV data into dynamic and visually stunning bar graph visualizations.
Following the steps outlined in this tutorial, you can create captivating visual representations of your data. Experiment with various customization options and animation techniques to enhance the impact of your visualizations. Let your data come to life and engage your audience with impressive bar graph visualizations in After Effects.
Thanks for reading. Don't forget to leave a comment below!